An infographic about landing page optimization (LPO) is the focus of this post, walking through the LPO process and then applying a test hypothesis to an example case study.
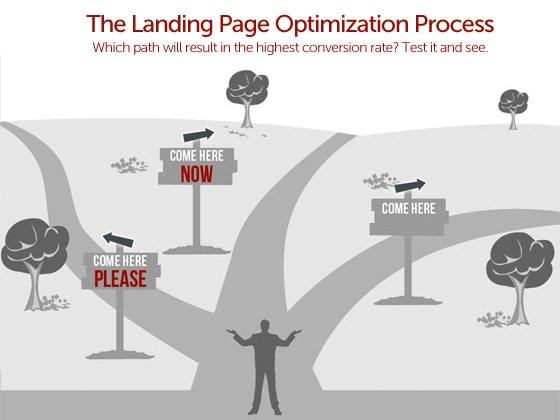
The Landing Page Optimization Process
Landing page optimization is all about making your pages perform better by hypothesizing how the context of use could be improved with regard to how your visitors are experiencing your landing page – a landing page being a standalone page with a single goal and a single call-to-action (CTA).
The process can be broken down into a number of steps:
- Decide which page element you wish to test.
- Place yourself in your visitors shoes and create a hypothesis that would be more persuasive in driving them to your CTA.
- Create different versions (variants) of your test element.
- Run an A/B/n test that pits each new variant against the original.
- Celebrate or cry when you see the results.
- Add, rinse, repeat. Optimization is a continuous process.
The Case Study
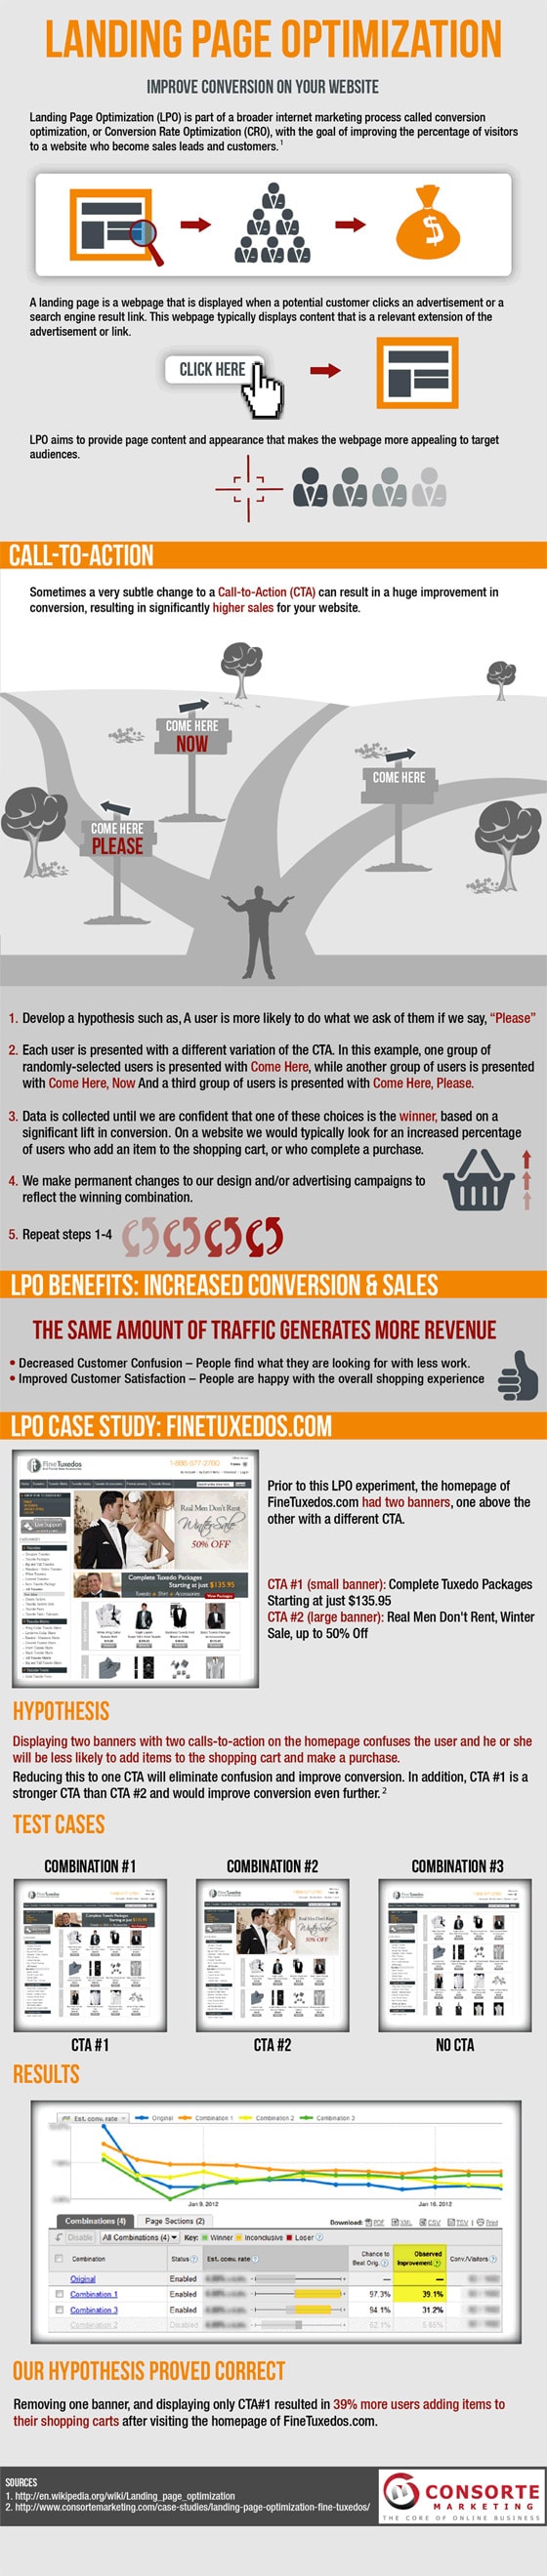
To demonstrate how LPO works, consider the example presented in the infographic which focuses on testing the CTA of a tuxedo store. Note, this isn’t a true landing page (it’s a homepage) but it is still adequate to demonstrate the principles of LPO.
The Hypothesis
Displaying two banners with two CTAs on the homepage confuses the user and he or she will be less likely to add items to the shopping cart and make a purchase.Reducing this to one CTA will eliminate confusion and improve conversion. In addition CTA #1 is stronger than CTA #2 and would improve conversion even further.
As you can see, the process was followed like so:
- The page element to test was chosen (the banner CTA)
- A hypothesis was written to explain the reasoning behind the test
- The test was split between showing CTA #1, CTA #2 and no CTA at all
- An A/B/C test was run to find out which variant worked best
The end result being that variant #1 increased conversions by 39%, proving that even a small tweak can make a significant difference. Imagine if you ran an ecommmerce store and with an optimization effort resulted in a conversion lift of 39% without driving more traffic! More sales on an ongoing basis.
The lesson here? Always be testing (ABT). And make sure you follow the process outlined above – pay particular attention to the hypothesis which is used to document and validate your tests.
Enjoy the infographic, and don’t forget to tweet about the LPO tips at the end of the post.

Tweetable Tips
You can change what gets tweeted before it goes out, so don’t be afraid to click.
- Sometimes a very subtle change to a Call-to-Action can result in a huge improvement in conversion
- LPO: The same amount of Traffic Generates More Revenue
- LPO aims to provide page content & appearance that makes pages more appealing to target audiences

