Methodology
How We Created This Report
The insights found in the 2020 Conversion Benchmark Report are the result of a months-long analysis conducted via our proprietary machine learning model and some very smart humans. Here, we’ll answer key questions that’ll help you interpret and apply the results.
If you’re looking for the scientific process behind our analysis, a complete methodology for the report can be found here.
Methodology
Benchmarks
How’d we get these numbers?
The conversion data analyzed in this year’s report comes from October 28, 2018 to October 28th, 2019. Our benchmarks were derived from 34 thousand Unbounce customer landing pages, including 186 million visits that culminated in 19 million conversions. (That’s a lot of conversions, folks!)
This year, we looked at six more industries than in our previous 2017 report. We had our machine learning model sort the pages available into topics (like industrial tools or medical law)—based on the content of these landing pages. We then manually refined this output to match 16 industries from the Global Industry Classification Standard and the North American Industry Classification System. Finally, we took the following steps to keep our data clean:
Accelerate results with simple CRO
Access the full Conversion Benchmark Report for detailed industry benchmarks, in-depth conversion rate insights, top-performing channels, and more.
Methodology
- We didn’t include analysis of any industries or subcategories with fewer than 400 pages.
- We’ve excluded pages with fewer than 500 visitors or no conversions.
- We excluded subcategories that we felt might skew the results, like landing pages for political campaigns, religious topics, sweepstakes, or terms and conditions.
Methodology
Throughout, we report the median conversion rates per industry, rather than the mean (average). As a measure of central tendency, the median is less impacted by outliers (landing pages that are converting super well or super poorly) than the average. We believe this provides a more useful picture of how you stack up compared to other marketers in your industry.
It can also be inspiring to see how the best pages convert. To provide this insight, we also include conversion data on the top 25th percentile of each industry. This means, in each industry section, you also see the median conversion rate when we just analyze the top 25% of landing pages. (And, typically, they convert around 10x better than the rest!)
What do I do with these benchmarks?
First, make sure you know your own typical campaign conversion rates. Then, we recommend starting with the overall industry benchmarks before digging into the section covering your industry. Whenever sample sizes allowed, we’ve also included conversion rates for subcategories and different types of calls to action—as well as insights based on how conversions relate to word count, reading ease, and sentiments. A few questions you might want to ask:
Methodology
- How are my landing pages converting compared to others inside my industry?
- Do my pages hit the suggested targets for word count or reading ease? For instance, are they too long or too difficult to read?
- Are other related industries (or subcategories) performing better than my own?
- Is it possible my copy relies on emotional language that might sometimes hurt my conversion rates? Are there other sentiments I could try to express instead?
Methodology
Once you know how you (or your clients) compare to most pages in your industry and where you could be doing better, you can create variants that apply some of the learnings from our machine learning analysis (see below for more) and then use A/B testing or Smart Traffic to validate them.
A note on COVID-19
The conversion data analyzed in this year’s report predates the spread of COVID-19 and its economic impacts. We realize that some of the industries featured—like travel, catering and restaurants, medical practitioners, and events and leisure—may be seeing very different conversion rates right now.
That said, these benchmarks represent what you can normally expect in stable periods, and they also reveal insights about visitor behavior in various industries that apply in most situations. You may be able to use the report’s findings to help you prepare for how to set your business up for more success online—or to inspire your rebound as the economy recovers. However, if you’re continuing to face great uncertainty in your business, this Small Business Care Package may be more immediately relevant for you.
Methodology
Reading Ease and Word Count
How’d we get these numbers?
Word count is based on the sum of all meaningful text our machine learning model found on a particular landing page, including headings, calls to action, supporting copy, testimonials, and fine print. It doesn’t include text featured in images or video, and only analyzes English pages.
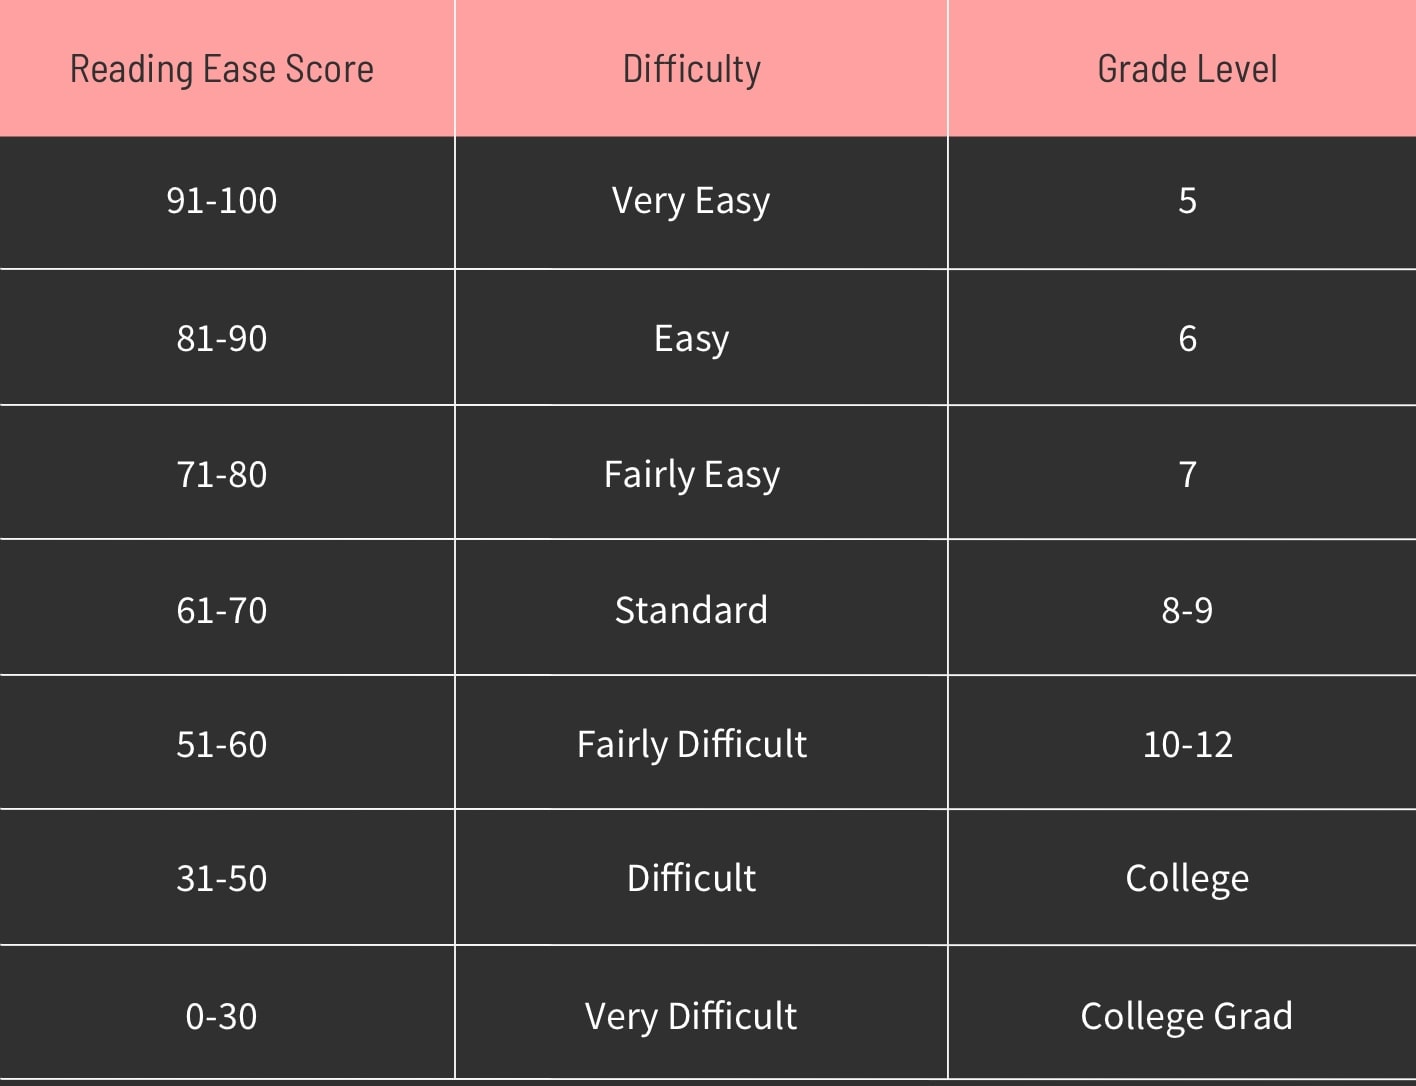
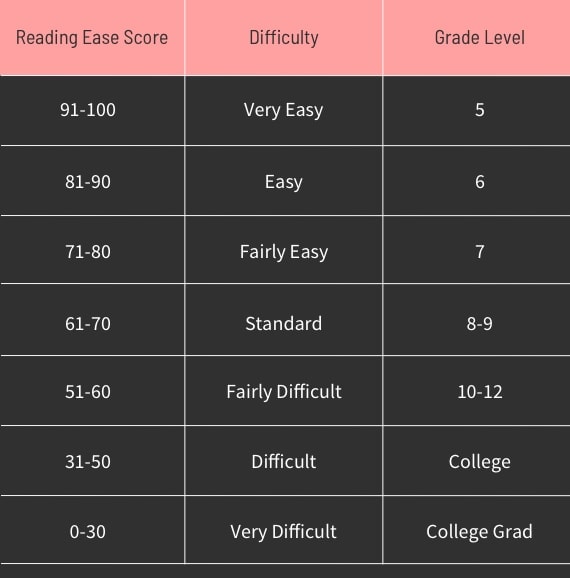
To find out how easy or difficult these landing pages were to read, we assigned each page a Flesch reading ease score (FRES) based on the number of words per sentence and the number of syllables per word. The higher the score, the easier it is to read.
Flesch scores can also be translated to grade levels. Grade levels aren’t consistent across school districts, countries, or time periods, however—so we preferred raw Flesch scores in our reporting and visuals. That said, you can use this table as a rough guide to figure out how easy you need your landing page copy to be for your best conversion rates possible:
Methodology
What do I do with reading ease insights?
There are dozens of free tools online you can use to find the FRES of your own writing, and tools like Grammarly and Yoast can also provide you with readability scores as you compose. Take a look at the reading ease data for your industry (or one like it) and write your landing page copy to match the reading level of the best converting pages. Then run an A/B test or Smart Traffic with the resulting variant.
In general, we found that easier-to-read landing pages had higher conversion rates than more difficult pages, but exactly how easy can differ quite a bit by industry. There are also exceptions to this rule, which we’ve highlighted throughout this report.
Methodology
Sentiment Analysis
How’d we get these numbers?
Our sentiment analysis is based on the NRC’s Emotion Lexicon (aka EmoLex), a list of English words associated with eight basic emotions (anger, fear, anticipation, trust, surprise, sadness, joy, and disgust) and two sentiments (negative and positive). We used machine learning to detect the concentration of these sentiment-associated words on each landing page as a way of determining overall emotions related to the copy that appeared.
What do I do with sentiment information?
Words from the EmoLex are used to detect emotion, but shouldn’t necessarily be your guide to expressing them. Instead, aim to convey sentiments in as natural a way possible. (Hiring a talented copywriter helps.) Though you can use the words in the lexicon as a starting point, stuffing them on your landing pages misses the mark and isn’t our intent by providing them.
In general, our analysis didn’t show as strong a relationship between emotions and conversion rates as it does with reading ease or word count, so we’d recommend making sentiment in your copy a priority only after you’re satisfied you’re doing well with the other factors.
This doesn’t mean, however, that sentiments aren’t important to your conversion potential. Use the insights in the relevant industry section to figure out which ones might have a positive or negative impact. As always, A/B test or use Smart Traffic to see how using different emotions resonate with your prospective customers.
Methodology
Survey Responses
How’d we get these numbers?
The Conversion Benchmark survey was fielded between December 2019 and February 2020. The adequate sample size of 396 (at 95% confidence) was calculated using Cochran’s theorem. We gathered 442 responses using a combination of email campaigns, social media channels, and paid advertising. We then screened for respondents in marketer roles.
The survey asked 12 questions about their digital marketing plans for 2020. We’ll be revealing other findings from our CBR2020 survey in a future piece of content.
Methodology
What To Do Next...
We created the Conversion Benchmark Report to help you kick your conversion rates up a notch, but that means putting these insights into play. Here’s how we recommend you do it:
Compare your landing pages to the benchmarks.
Explore which landing pages are performing best in your industry and see where you stack up against them. Are you converting where you need to be? Even better? What are the most successful pages doing that you can learn from?
Turn your learnings into a new approach.
Build one or more variants that apply what you’ve learned from this report to your existing campaigns and offers. Add or remove copy, dial down the difficulty, or add a little emotion to see what happens.
Use machine learning to reach your conversion potential.
Impressed with the machine learning used throughout this report? There's even more where that came from. After building your variants, turn on Smart Traffic to automatically optimize your landing pages throughout the life of your campaigns. Learn More.
Credits
Authors
Colin Loughran, Cecilia Martinez, Nicole Wright
Fueled by data and insight from
Philip Jama, Jon Lehrer, Tommy Levi
With contributions from
Jennifer Pepper, Rachel Scott, James Thomson, Alana Thorburn-Watt
And support from
Luke Bailey, Anca Bujor, Jennifer Chin, Sarah Gooding, Ashley Luk, Simon Mathonnet, Leslie Ty, and Bradley Wou

Methodology
Build and launch your landing pages quickly (without the headaches)
No more being at the mercy of your designers’ and developers’ calendars to launch a single landing page for your next marketing campaign. With Unbounce you can run the show from start to finish with a drag-and-drop builder, 100s of templates, built-in mobile responsiveness, AI copywriting, unlimited test variants, and more.
Launch better pages, faster with Unbounce