Before I address the burning question in the headline, let’s rewind to the start of product awareness month for some context.
I kicked 2018 off with a bold, self-inflicted challenge to write 30 blog posts in 30 days in a bid to increase adoption of our two new products, Popups and Sticky Bars.
The initial thinking was to call this effort Product Marketing Month, with the content based on my journey to become a more proficient product marketer. As I shared at the start of the journey, the adoption of the new products had been disappointingly low; only 6% of our customers were using them when I first started looking at the numbers in August. That number was probably around 7% or 8% at the start of January.
Being a marketer who hadn’t actually practiced the discipline of product marketing, I thought that by talking about our products more directly in the content – including interactive demos and interesting use cases – coupled with a redesign of the blog just for this new content, we’d crush those numbers with ease.
I was incredibly naive
Boy oh boy was I wrong. Not only did I misinterpret what product marketing is: an expansive function and process that includes customer insights, data analysis, product validation, positioning, and market research, but I assumed that top of funnel content alone could drive new trial starts and impact adoption.
In my moment of hubris, I even bought the domain whatsproductmarketing.com where I intended to have a blank white page with the word “Marketing” on it. Cos that’s all product marketing is, right? Nope. In the end, I decided against that brazen approach.
It quickly became clear that what I was actually doing was more closely tied to product awareness. As with many other SaaS content marketers, I had little control or influence over what happened to people after they sign up. So we repositioned the challenge as Product Awareness Month.
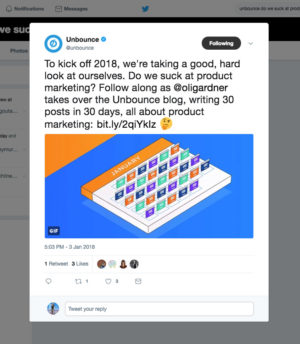
I also inadvertently caused offense to some folks in the company by including a question in the first blog post that posited “Do we suck at product marketing?”.
While I’d intended it as a question (to start the post with a provocative buzz-generating bang), it came across more as a statement, and pretty offensive one at that.
I think it was co-founder Carter Gilchrist who helped me understand the impact by asking me “If you’d said ‘Do we suck at design? Or do we suck at engineering?’ how do you think the team would feel about it?” Pretty shitty I imagine. I removed that line from the post. The talented people on our product and product marketing teams deserve better than that.
The 30-Posts-in-30-Days Challenge
The best part of this challenge was getting back to writing. Because I’ve been on the road so much as a public speaker recently, it turns out I hadn’t written a single word on our blog (or Unbounce marketing content in general) for two years.
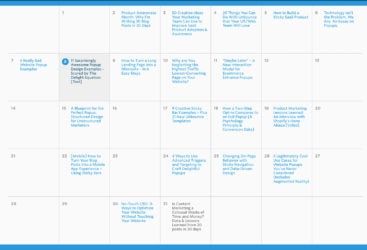
30 posts was an audacious goal. Especially when you consider how much of it was designed to be an exploration of an approach to marketing that was completely new to me. The posts ranged from 700 to 7,000 words in length and included many interactive demos of our new products baked right into the blog posts – including many hacks that required custom code.
Fortunately, I collaborated with some incredible Unbounce developers:
- Sam Shen – who, with Sabrina Chan’s mockups, built a redesign of the blog (just for the new product marketing category) in two days.
- Noah Matsell & Brian Burns – who saved my ass by providing many custom workarounds, use case examples, and interactive demos. The most impressive of them being a way to communicate across domains to set and read cookies so that I could demo the cookie targeting feature of the new products.
- Luis Francisco – one of our designers who is rapidly becoming one of the best hackers of Unbounce. Including the mind-blowing augmented reality demo in my 5 Legitimately Cool Use Cases for Website Popups post.
Not to mention the guidance, brainstorming, reality checks, and content planning help of the awesome Jen Pepper, and five designers who took turns creating the majority of the blog post hero images under the guidance of Cesar Martinez.
The craziness of the challenge was important to me. I don’t get inspired by normalcy. I love chaos and ridiculous ideas, and honestly, if I’d planned on writing three blog posts I probably wouldn’t have written any.
Turns out I was a bit too ambitious, and after ten consecutive sixteen hour days (weekends included) I decided to remove weekend posts from the schedule because they get little traction anyway, and focus more on quality than quantity, resulting in this post being number 20 – still pretty damn good.
Pretty sure my wife Nicole would’ve disowned me if I continued at that pace with the neglect that came with it. #alwaysbeoptimizing
Content Marketing Performance: Was I Wasting My Time?
Given that I was now dealing with pure product awareness, the topic of content marketing, in general, became top of mind. In particular, how does our blog perform as an agent of customer acquisition?
Digging into Kissmetrics I was shocked by what I uncovered.
As an attributable part of customer acquisition, the content I’d written on the blog in January was converting readers to NTS (new trial starts) at the paltry rate of 0.3%. Let me repeat that. Zero point three percent.
The blog converts at 0.3%. WTF?! How can that be the case?
To be fair – while the team had known about this conversion rate for some time over the course of 2017 — I couldn’t help but see the results of Product Awareness Month, consider all my effort, and wonder what was I doing so wrong with the posts that this number was still a possible reality? Content has been the hallmark of our marketing since we started Unbounce 8 years ago.
Time to dig deeper into the data.
The Data Insights & Lessons Learned I’ll be Sharing in This Post
In the interest of transparency (one of our six core values), I’ll be sharing the data I could find that helps shed light on the performance and effect of my month of madness.
It’s important to note that the full impact of this endeavor won’t be visible for a few months for a couple of reasons: we measure a customer as someone who’s paid us three times, and true product adoption can occur at any time.
Here’s a linked list of the data, insights, and learnings that you’ll find in the remainder of the post.
- The number of NTS (new trial starts) attributed to Product Awareness Month
- Historical NTS attributed to the blog
- How other companies content marketing performs. I reached out to:
- Andy Crestodina from Orbit Media
- Cyrus Shepard formerly at Moz
- John Bonini from Databox
- Impact of the blog redesign
- Blog traffic
- Blog Subscription Conversion Rates for different popup trigger types
- The impact of changes to our highest organic traffic page
- SaaS app login data
- Product awareness and adoption numbers
- How many words I wrote
- Impact on writing quality
- What I should be writing about next
I’ll also discuss what I learned as a marketer, writer, and SaaS co-founder, after living the past 30 days like this.
Insight #1 – Blog Conversion Rates to NTS attributed to Product Awareness Month
Here’s a look at the funnel report in Kissmetrics that shows the conversion rate from visits to the new content to new Unbounce trial starts (NTS).
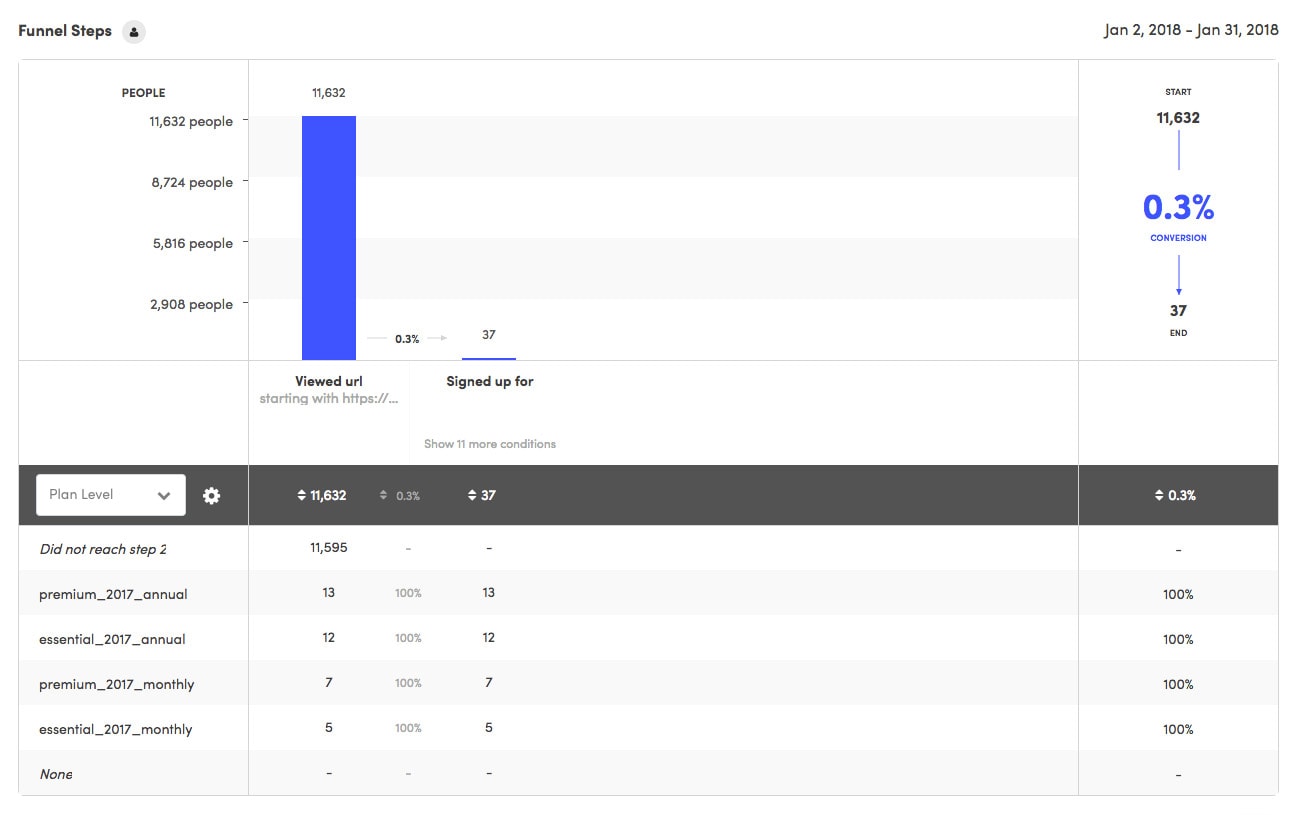
As I mentioned, I was really shocked by this number. Only 37 NTS from all that effort? I was starting to think that my content simply wasn’t interesting or relevant enough to convince people to sign up.
Was it just me?
UPDATE: December 2018
Initially, when I looked at the data above, I thought that the Product Awareness Month (PAM) content hadn’t had any impact on improving blog conversion rates, but it turns out I was completely wrong. When looking in Kissmetrics, I’d chosen an incorrectly configured segment, and the real truth was much more exciting.
You can see from the diagram below, that the PAM content outperformed the blog average in a big way, in all of the highest-traffic categories on the blog. It did drop a bit for the PPC category – which is an important one for us – but I think that’s easy to turn around by focusing the new blog header to be around landing pages only, as opposed to the three products that you’ll see in the blog redesign in insight #4.

Insight #2 – Historical Blog Conversion Rates
Then I looked at some historical data to make a comparison. The chart below is for the previous 9 months of blog content. I would’ve looked further back in time, but since we switched the website to HTTPS the reporting gets a little more complex.
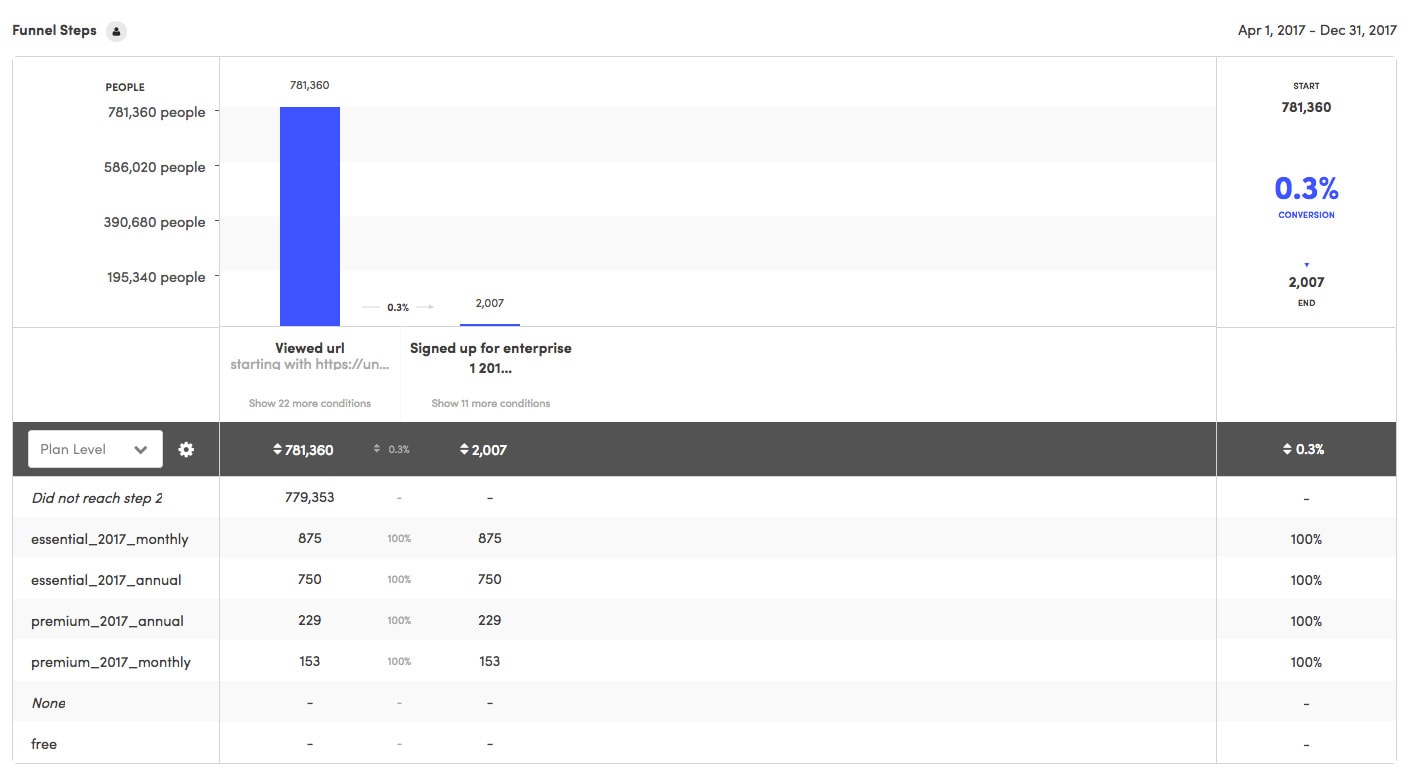
Turns out that our blog converts at that rate in general. It’s important to note that the second chart is based on every single blog post on the blog, for a 9 month period, which is why the actual number of signups is so much higher.
At least it’s not just me.
Now, you may be inclined to think that given the low numbers, the blog doesn’t have the efficacy to warrant its existence or at least the amount of effort that goes into maintaining it. I know I started having some doubts.
But then I reached out to some industry folks who I deeply admire for their content marketing prowess, to see what their experiences and thoughts were on the topic.
Insight #3 – Content Marketing at Other Companies
The first person I contacted was Andy Crestodina, co-founder of Orbit Media a Chicago web development a design agency. Andy is a good friend, an incredible speaker, and a genius content marketer whose expertise I value highly. Here’s what he had to say:
This is an awesome question that gets to something that a lot of content marketers may not understand: it’s the indirect benefits of content marketing that drive results. And in a lot of cases, it’s about SEO. The content drives the links, which drive the authority, which drive the rankings, which drive qualified visitors who searched for a “commercial intent” keyphrase …and now you have a visitor who is highly likely to convert, unlike your typical blog reader.
Here’s the data on our analytics. We had just over a million visits last year. (yay!) And 91% of those visitors started on a blog post.
But do these people ever really turn into business leads?
…not really. Almost never actually. But obviously, we’d have a lot less traffic (brand awareness) if we didn’t publish anything. Our site would be just a brochure. We wouldn’t have followers or subscribers. But the other downside of not having a blog (and maybe the most important benefit of blogging) is the links.
According to Open Site Explorer’s “Top Pages” report, there are virtually no links to our service pages. The top 217 linked-to pages, except for the home page, are blog posts and authors.
So without these pages, we’d have no authority …and no ranking for the “money phrases”.
If you want to attract visitors who have strong intent, who have their wallets out, you have to have a lot of content, links and authority so you can rank for the phrase. I bet the Unbounce analytics and rankings look a lot like this.
If you want the fortune, you’ve got to get the glory first!


Genius.
I also reached out to Cyrus Shepard, the former Director of SEO & Audience Development at Moz. Here’s what he had to say:
Our content with the highest conversion rates were always surprising and very specific (posts about title tags and how to run a site audit). The problem was, while these pieces had a 5x conversion rate over other content, the number of overall conversions they drove was actually small compared to our total. In other words, if we would have focused on these micro-problems exclusively, our overall sales would likely have been much smaller.
Counter-intuitively, we found we did better on big content with corresponding ridiculously low conversion rates, because it raised awareness. Awareness raised brand interest/queries, and 2-3-4 months down the line we close the sale when they are ready to purchase. In other words, our content with the actual highest conversion rates—as it is with all companies—was our homepage and “about” pages (and also our tools, but that’s another story). So raising brand awareness long-term always trumped short-term content-specific conversions.
Some similar sentiment to Andy where the long-term thinking, and believe that if you publish exceptional content you will benefit in indirect ways.
Finally, I reached out to John Bonini from Databox, who explained how they use dashboards (created with their own product which looks awesome) to keep a close eye on blog attribution. Here’s the one John shared with me. I embedded it in an iFrame so I’d suggest clicking inside it to scroll inside the different data blocks.
And here’s what he had to say about how their blog benefits their business:
1. For us, the blog plays a pretty powerful role in getting readers into the product. We transitioned to freemium last year, so the barrier to entry into the product is low. What works well for us is covering the challenges that marketers and salespeople are having in tracking performance and making sense of their data. Rather than rely on premium content like ebooks and webinars (we use these more for customer marketing) we’ll include free templates for dashboards that help solve the problem we’re writing about. It’s a fairly straight line from problem>>solution, which is why the blog is such a powerful lever.
2. Content attribution is hard. And the reality is that monthly reporting decks are binary–were the goals hit or not? Are we growing at or above the rate we need to…or not? Gross revenue was X. ARR is Y. So when you start talking about the importance of multi-touch attribution in order to measure the effectiveness of the blog, you run the risk of seeming like you’re “in the clouds.” I’ve had heated debates with executives who felt strongly against “being a publishing house.” Because attribution in many cases wasn’t a straight line, the content to them was fluff, and the time spent on it was sunk cost. The best thing to arm yourself within those cases is specific examples. Measuring the aggregate success of your blog is hard, but when you’re tracking the success of specific blog posts you know see a lot of traffic, you can better illustrate the value in producing more and optimizing for the long-term. That’s why I use the attached chart to keep an eye on our top visited pages (most of which are blog posts) and track the number of signups coming from each. As organic traffic grows, so does the output from each post. If you can convey that quickly and succinctly, you make a strong case.
Who’s Reading Your Blog?
We need to also recognize the fact that sometimes the person reading your content isn’t the person who ends up paying for it. There’s a difference between a functional user and a functional buyer, and that’s why attribution is the single biggest challenge in marketing today.
Connecting the who with the what with the when and the why is very difficult, for almost everyone.
Takeaway – It’s all yo’ blogs too!
We need to think a little differently when choosing the metrics we assign to our content marketing. I’d love to hear about how your blog performs in regard to similar metrics. Jump in the comments if you’d care to share.
It’s worth discussing a few other factors when thinking about the value of a blog. I know that personally, when I’m looking at the website of a software or service provider, if they don’t have a team page with photos of the company’s employees, a physical address for the office, and a blog that’s active, I won’t give them my business – unless they are the only option.
In many ways perception is reality.
If you don’t appear to be active or don’t appear to be a thought leader in the space you’re selling in, you simply don’t appear as credible as a company who is.
So Is Content Marketing a Waste of Time & Money or Not?
No. Clearly not. You just need to understand the nuances of how you measure your ROI so that you’re not thrown off by the metrics and numbers I’ve just shared with you.
In the rest of this post, I hope you will learn enough to persuade you if you’re not persuaded about the value of content marketing, and if you already are, I hope you learn some brilliant tactical ideas for 2018.
Insight #4 – Impact of the blog redesign
In this section, I’ll cover the impacts a new blog design (just for this month’s posts) impacted interaction behavior. I’ll break it down into three sections:
- Sidebar: How did a new product focused sidebar perform?
- Header: We introduced a new header navigation bar with a different focus.
- Old posts: A comparative look at how the header and sidebar interaction was on posts with the old design.
- Individual posts: How did interactions with the header CTAs vary between different post topics?
Insight #4a – Impact of the blog redesign: analyzing the new sidebar
Part of the redesign included a new sidebar dedicated to the two new products. You can see the before and after designs below.
Blog Design Before and After
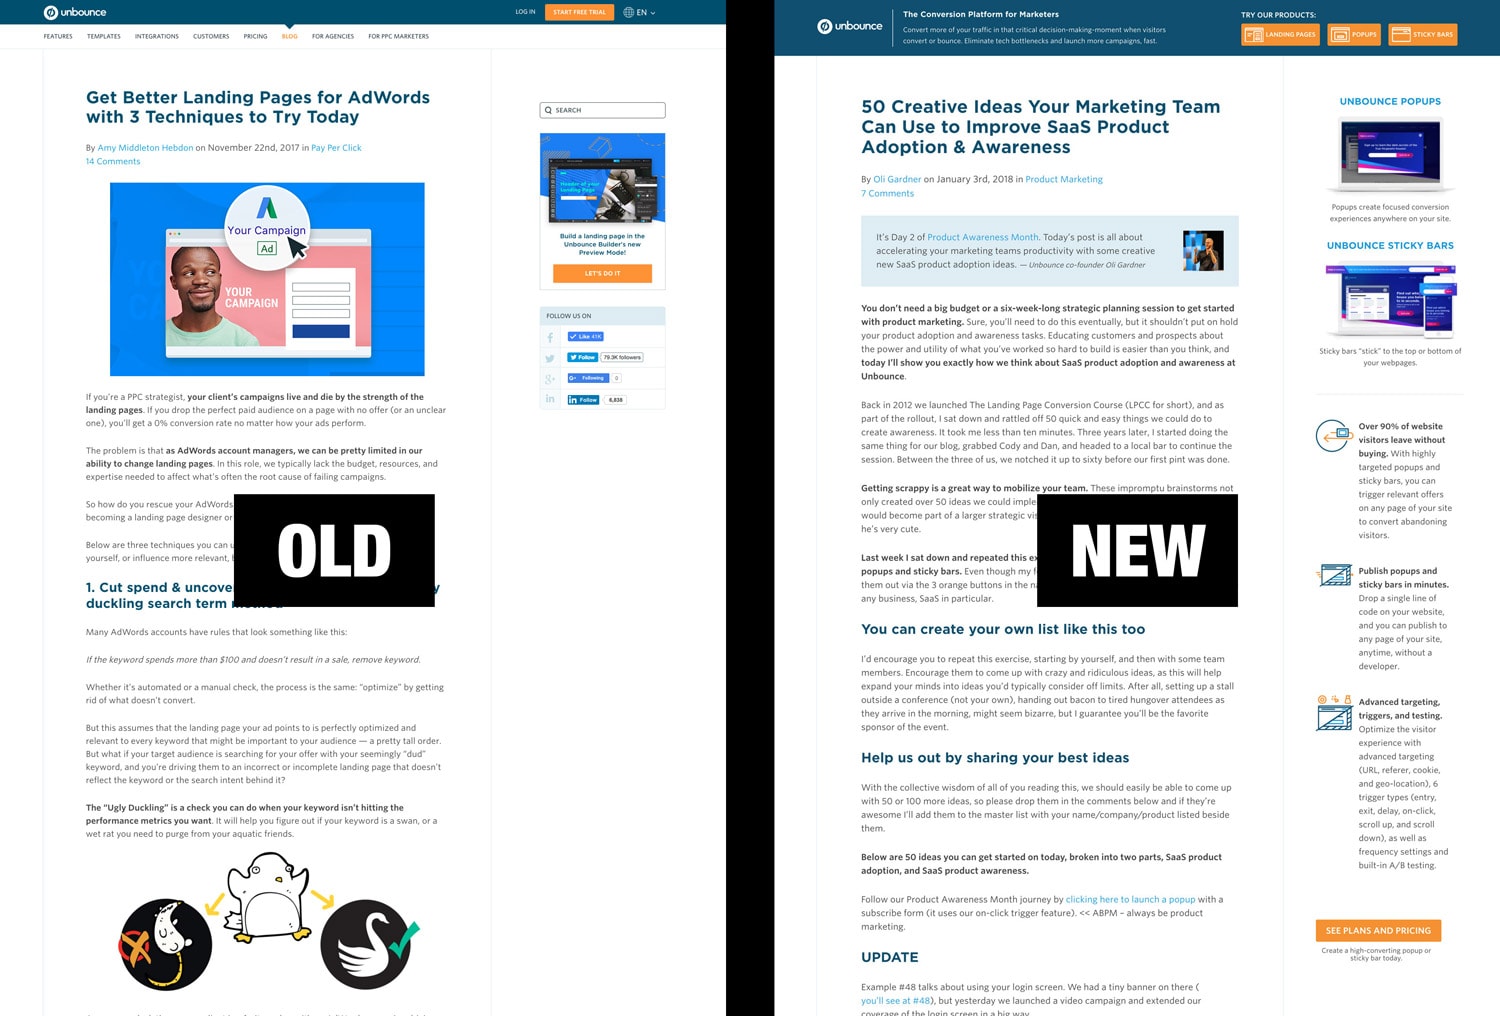
I was pretty excited to see how this would perform as we’ve never been that blatantly promotional on the blog before.
Here’s a click heat map based on traffic to the first few posts. The screenshot background is auto-generated from the first post, but the sidebar and header were constant elements that show cumulative clicks.
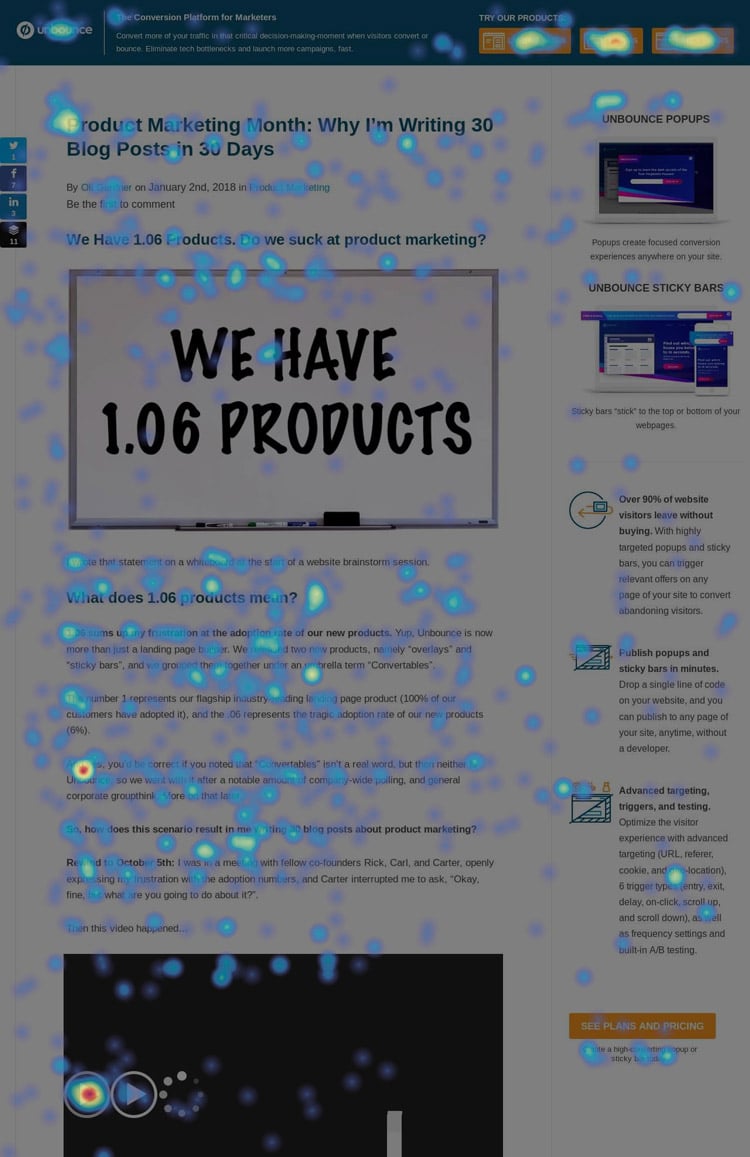
Out of 1,481 (desktop) visitors and 3,428 clicks, only 3 people (0.09%) clicked the sidebar CTA. More people clicked on the statement beneath the button than on the button itself.
My first instinct was to think that the subtext read as a clearer and more actionable statement than the button copy, so I reversed them (putting the subtext as the button copy), but it changed nothing.
Nobody cared about the sidebar CTA.
Something to note is that it wasn’t a sticky sidebar (it disappears as you scroll) which no doubt had an impact on the low engagement numbers, but the content was too long to make it a persistent sidebar because the CTA wouldn’t be visible in most browsers.
Takeaway – Nobody cares about your sidebar
After a week with little to no interaction with the sidebar, we decided to simply remove it. I think the reading experience is significantly nicer without it.
Insight #4b – Impact of the blog redesign: analyzing the new header
The more significant change to the blog was the new header. Removing the standard SaaS navigation with features, templates, integrations, pricing etc. allowed the content to be the focus, with a greatly simplified expression of our product’s value proposition.
Here’s a wireframe for the new header.
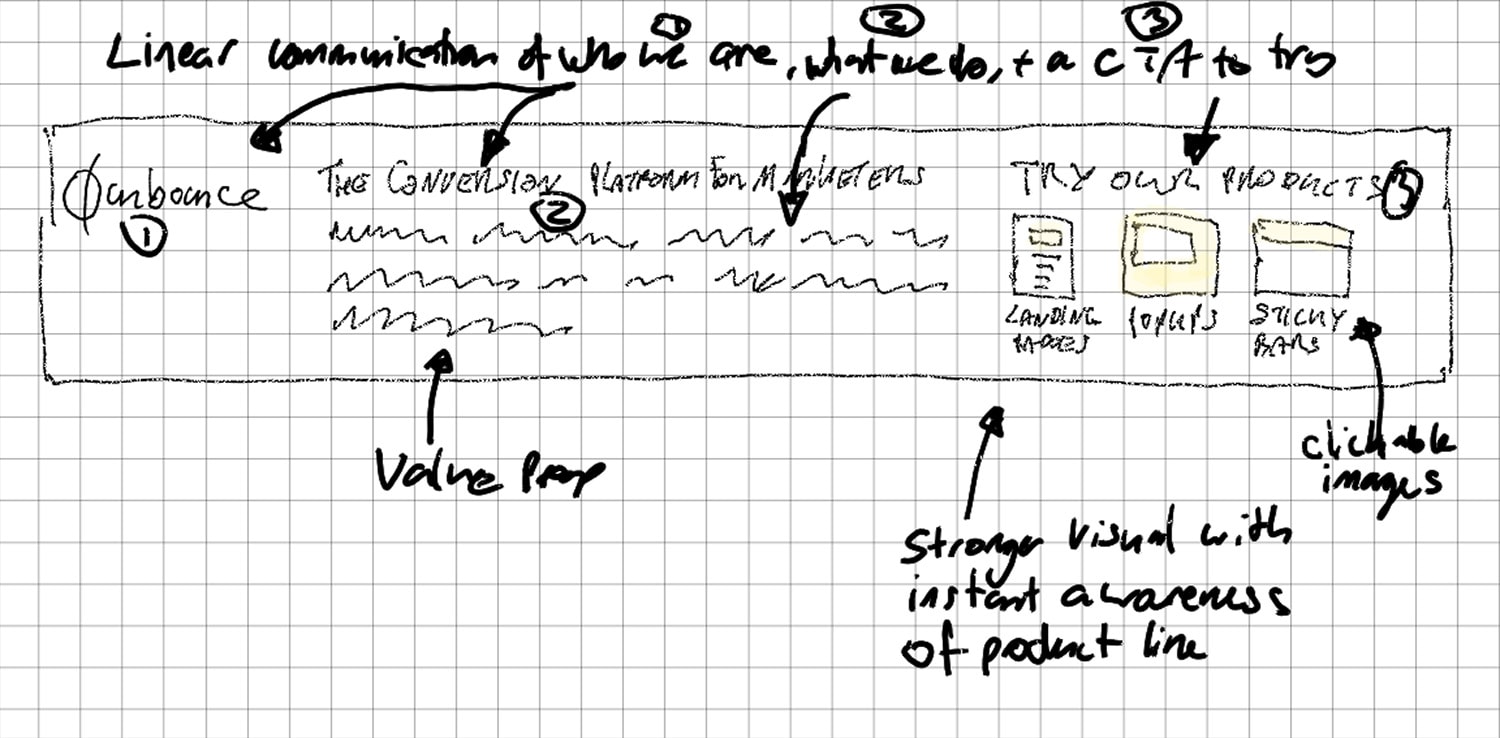
I loved nerding out with my new reMarkable tablet to sketch many of the diagrams and illustrations throughout the month. Apologies for my terrible handwriting, but if you’re a visual thinker and communicator it’s the best product I’ve ever used.
Let’s take a look at some heat maps for the header.
Week One
The heat map below is for the first four blog posts and shows quite a lot of activity on the three product CTAs.

Number of clicks
[Landing Pages: 26] [Popups: 39] [Sticky Bars: 43]
Total clicks on product CTAs
108 out of 1,481 clicks = 3.15%
Week Two
The next one is for the middle part of the month after the sidebar had been removed.

Number of clicks
[Landing Pages: 106] [Popups: 124] [Sticky Bars: 99]
Total clicks on product CTAs
329 out of 7,596 clicks = 4.42%
Week 3
Week 3 is missing because I’m an idiot and forgot to start the heat map recording in Hotjar.
Week 4
Later in the month, the heat map tells a slightly different story. Note that this is a smaller sample size as it’s not been collecting data as long.
Number of clicks
[Landing Pages: 16] [Popups: 28] [Sticky Bars: 33]
Total clicks on product CTAs
77 out of 2,387 clicks = 2.56%
The lower % of clicks here might be explained by repeat visitors not having a need to click again. Or it could be the topic and quality of the posts, or it could be a sampling issue.
Insight #4c – Click Map Data From Old Posts
To gain some comparative perspective, I dug out some heat maps from blog posts that have the original design, to see how they fared. It’s not an apples-to-apples comparison as the CTAs are not the same in both designs.
But it is interesting to note that on this blog post about 35 landing page design examples, the combined number of clicks on the top CTA and the sidebar CTA was 2 out of 1,844.
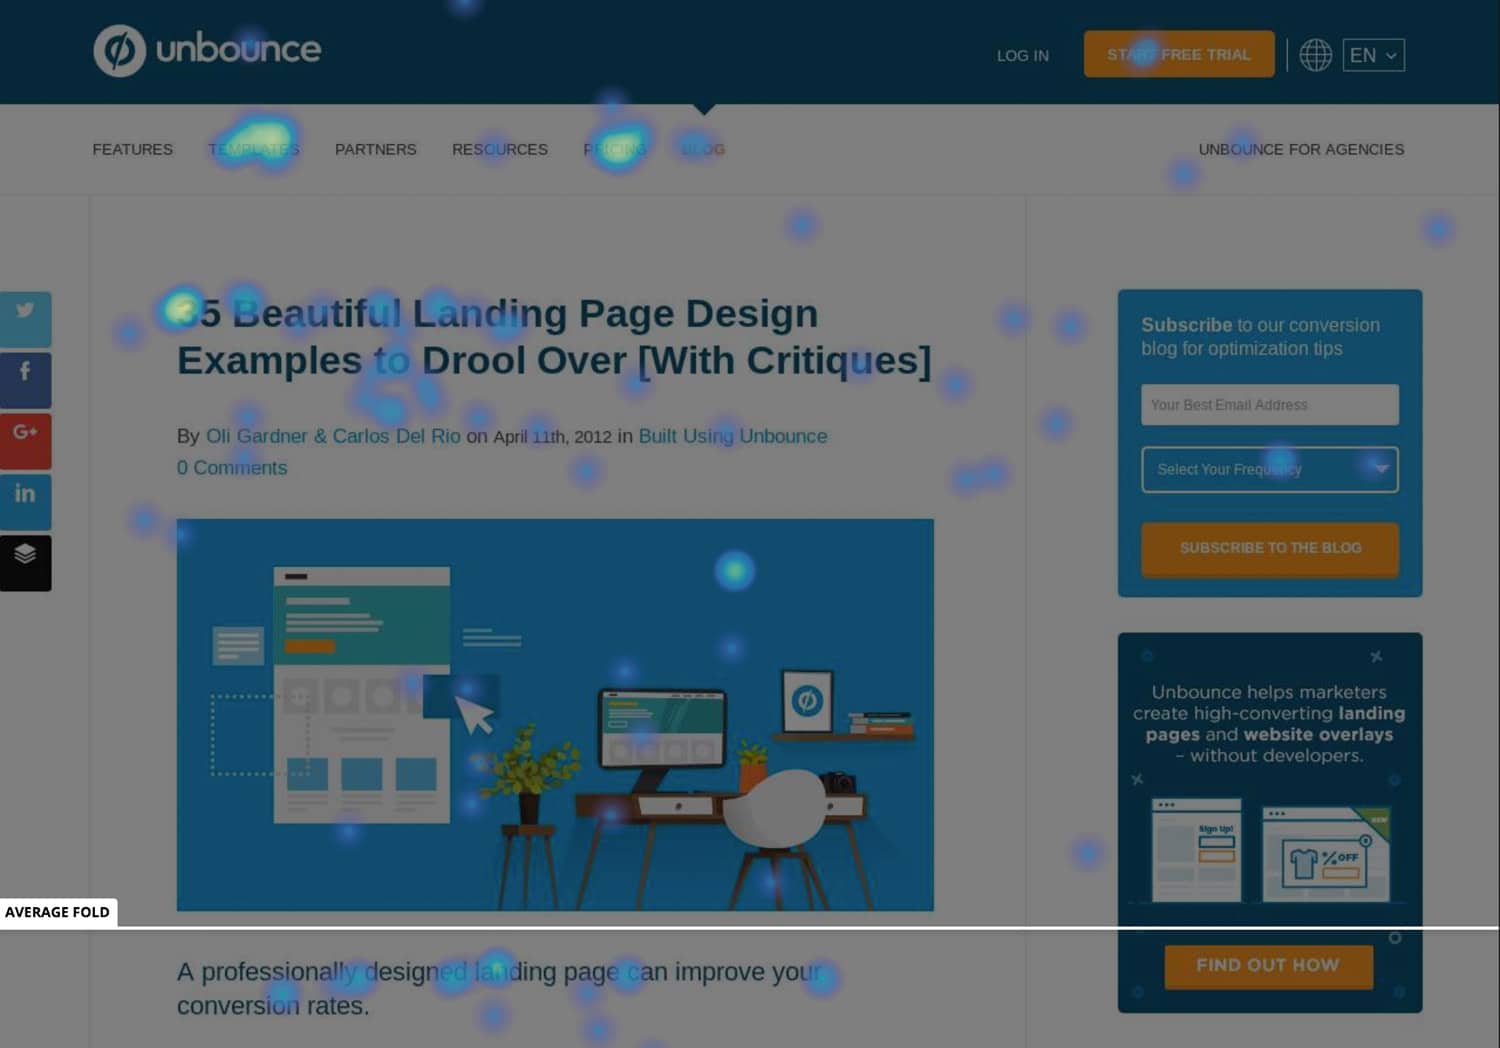
And a similarly high-traffic post only received 6 clicks out of 1,777 visitors.

It seems you have to work really hard to get people to click your product CTAs from a blog post.
Insight #4d – Interaction Based on Blog Post Topic
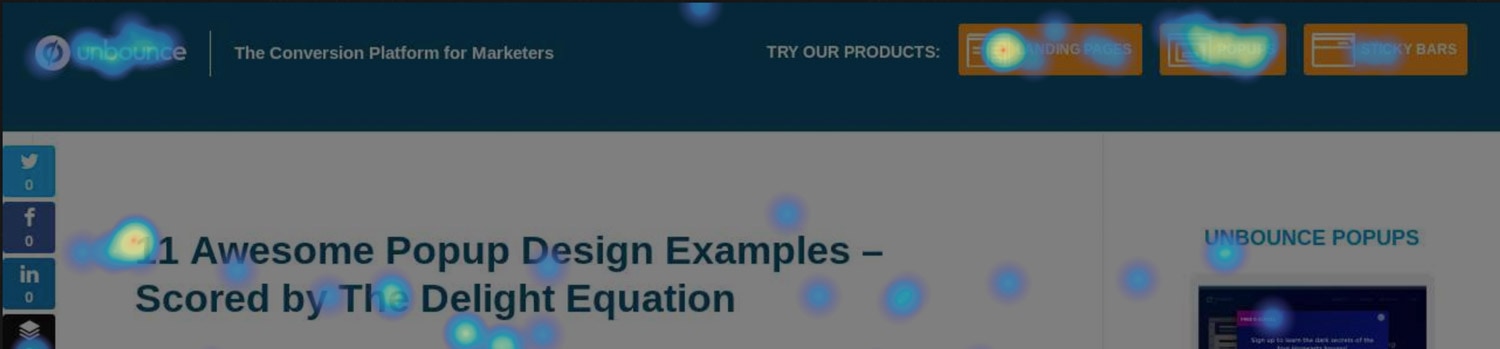
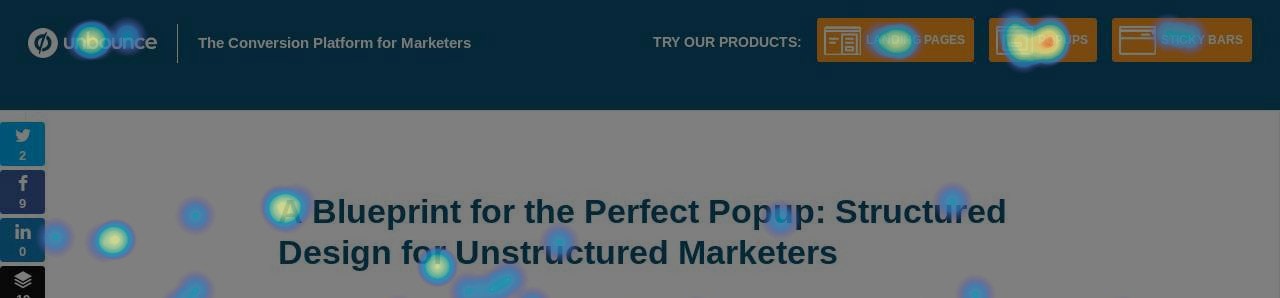
If we look at individual posts from Product Awareness Month, we can see some really interesting patterns based on the topic of the post. For the five posts below, all of them have a dominant percentage of clicks going to the product being discussed in the post.
In the examples below the values represent the number of clicks each CTA received.
Popup Post 1: A Blueprint for the Perfect Popup
[Landing Pages: 4] [Popups: 13] [Sticky Bars: 2]
Popup Post 2: “Maybe Later” – A New Interaction Model for E-commerce Entrance Popups
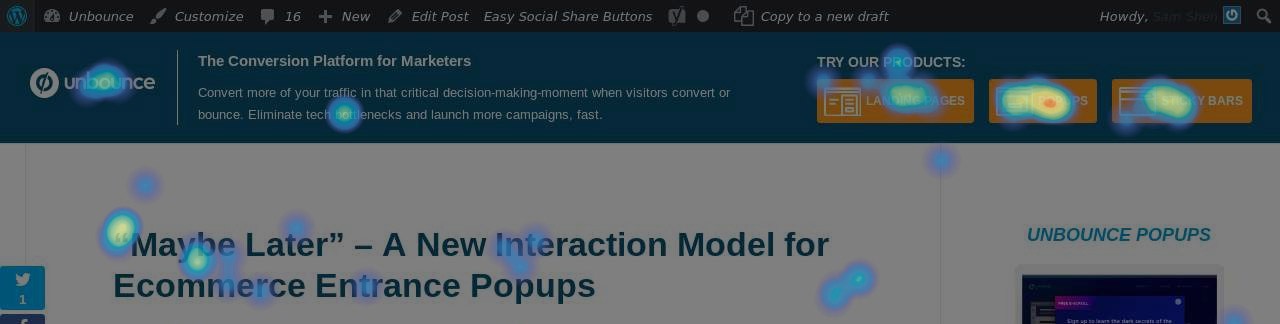
[Landing Pages: 9] [Popups: 20] [Sticky Bars: 12]
Popup Post 3: 11 Awesome Popup Design Examples – Scored by the Delight Equation
[Landing Pages: 11] [Popups: 16] [Sticky Bars: 2]
Sticky Bar Post 1: 9 Creative Sticky Bar Examples – Plus 21 New Unbounce Templates
Super low traffic on this one, but the pattern remains intact.

[Landing Pages: 1] [Popups: 3] [Sticky Bars: 9]
Sticky Bar Post 2: How to Build a Sticky SaaS Product
This one’s not really even about sticky bars per se. It just has the word in the title and an equal measure of mentions of the sticky bar and popup products.
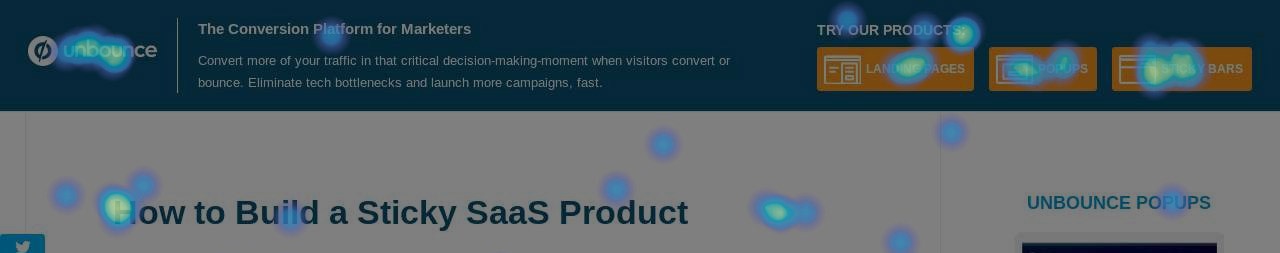
[Landing Pages: 4] [Popups: 5] [Sticky Bars: 9]
Takeaway – Context Matters
Now it might seem obvious that it would be the case that the blog post topic would dictate product interest, but it’s still really nice to confirm it through data and to know that the content is indeed driving the intended behavior from the audience.
Insight #5 – Blog Traffic
One of the things we’ve been learning of late is the importance of getting back to basics with SEO, and writing content that people are actually searching for. Obvious enough. But that’s not what I had in mind when I started this month of content production. I was stuck in my own head, with my own concepts, and my own ideas of how I was going to change things.
As a result, about half of the content I wrote has an easily identifiable search term to optimize for. But the other half don’t.
I’m okay with that, to an extent, because I firmly believe you can’t spend all of your time answering people’s search questions. That’s a critical path to business success, but in order to rise above your competitors, you also need to invent things. To come up with new ways of thinking – actual thought leadership.
I have an innate need to create things that not only scratch an itch in myself, to expand my intellect, and thought process, but also because I want to inspire someone else to care or grow, or experiment, and think in ways they hadn’t previously considered.
It’s similar to the concept of breaking content marketing into two buckets of lead gen and awareness. You need inspiration as well as resolution.
I digress. What’s the traffic to the blog been like this month? Well for starters, when I made this crazy challenge to myself, I didn’t realize that our blog traffic has taken a big hit in the past year. I’m not sure what my decision-making process would have been had I known. Do I get more excited because I want to re-energize the blog? Or do I think that it’s not worth the effort if we don’t get much traffic anymore?
Here’s a GA chart of traffic to our blog since we started Unbounce in 2009.
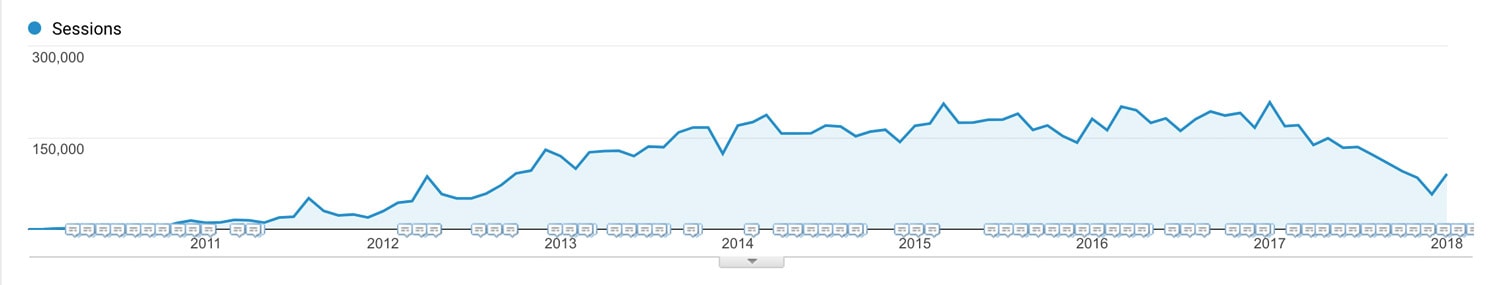
You can see that in early 2017, things changed, pretty dramatically.
(You can also see that we’ve got a decent boost this month).
If we segment this by organic traffic and compare April 2017 to January 2017, you see a graph like this, where we lost around 35% of our organic blog traffic in one quarter.
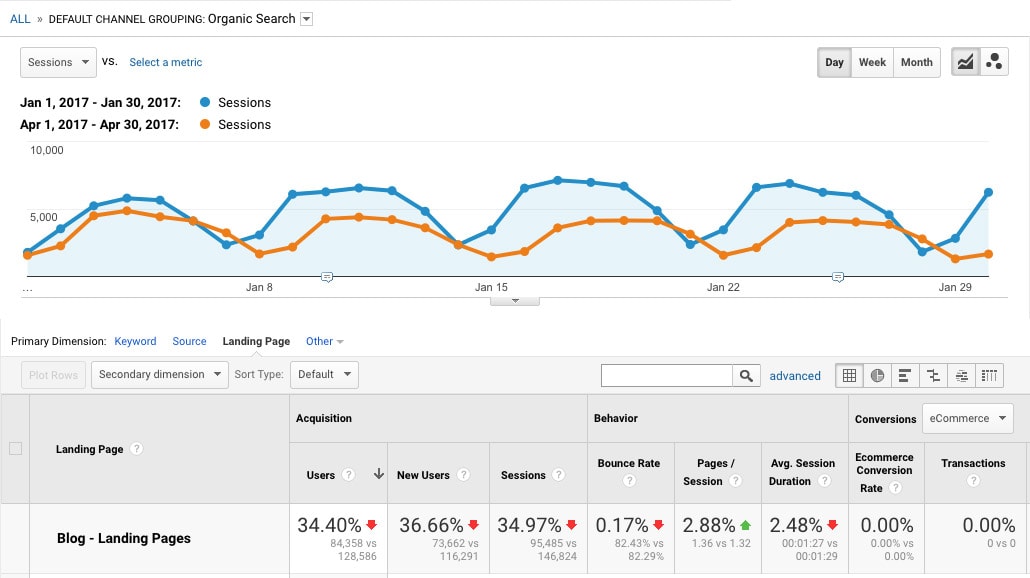
I reached out to Cody Campbell, our Marketing Manager of Funnel Growth (and resident SEO pro) for an explanation. Here’s how he described what had happened:
We have 1250 posts published on the Unbounce blog.
In 2017, those posts drove 1.6 million sessions to our blog. That’s 18% of total website traffic.
Of that 1.6M sessions, 77% was Organic. Yay for SEO…but this was also an incredibly terrifying fact at the same time. We had all our eggs in one basket. And lucky for us, that basket was performing really well. Until it all came crashing down.
The Largest Traffic Drop of 2017
In the 4 month period between January and April, blog traffic dropped 74,000 sessions.Here’s the breakdown:
Organic: 60k decrease
Direct: 7.3k decrease
Social: 2.2k decrease
Email: 5.3k decreaseAfter digging deeper, we found that the majority of the traffic drop came from 23 posts. Wait. What? 1.84% of our posts were driving the bulk of our blog traffic? Yup.
…Holy sh!t. What happened?
Most of those high traffic blog posts were written between 2012 to 2016 and we hadn’t touched them since. Meanwhile, numerous competitors entered the market and content marketing hit its climax.
The result?
We’re now competing against a ton of other companies in the Google SERPs all of whom are trying to rank for the same keywords.Our competitor’s content was far more up-to-date than ours (and in some cases even better), so, naturally, it started to get more attention from readers. Google took notice and started dropping us from position #1 to position 2 or 3.
Moving from position #1 to #3 lost us up to 50% or more of our traffic per post. And when that happens and you only have a handful of posts holding up your blog, you’re in trouble.
Takeaway
In a highly competitive space, it’s critical that you maintain your organic rankings by updating and optimizing your important blog content so it doesn’t fall below the quality and impact of what others are doing.
Insight #6 – Blog Subscription Conversion Rates for Different Popup Trigger Types
In order to explore the concept of two-step opt-in forms, I set up two methods for people to subscribe to the weekly email digests we created for those interested in following along with Product Awareness Month.
Version 1 used an exit-triggered popup to present the subscribe form, and version 2 used a click-triggered popup to create the two-step opt-in experience.
Here’s the popup people were shown:
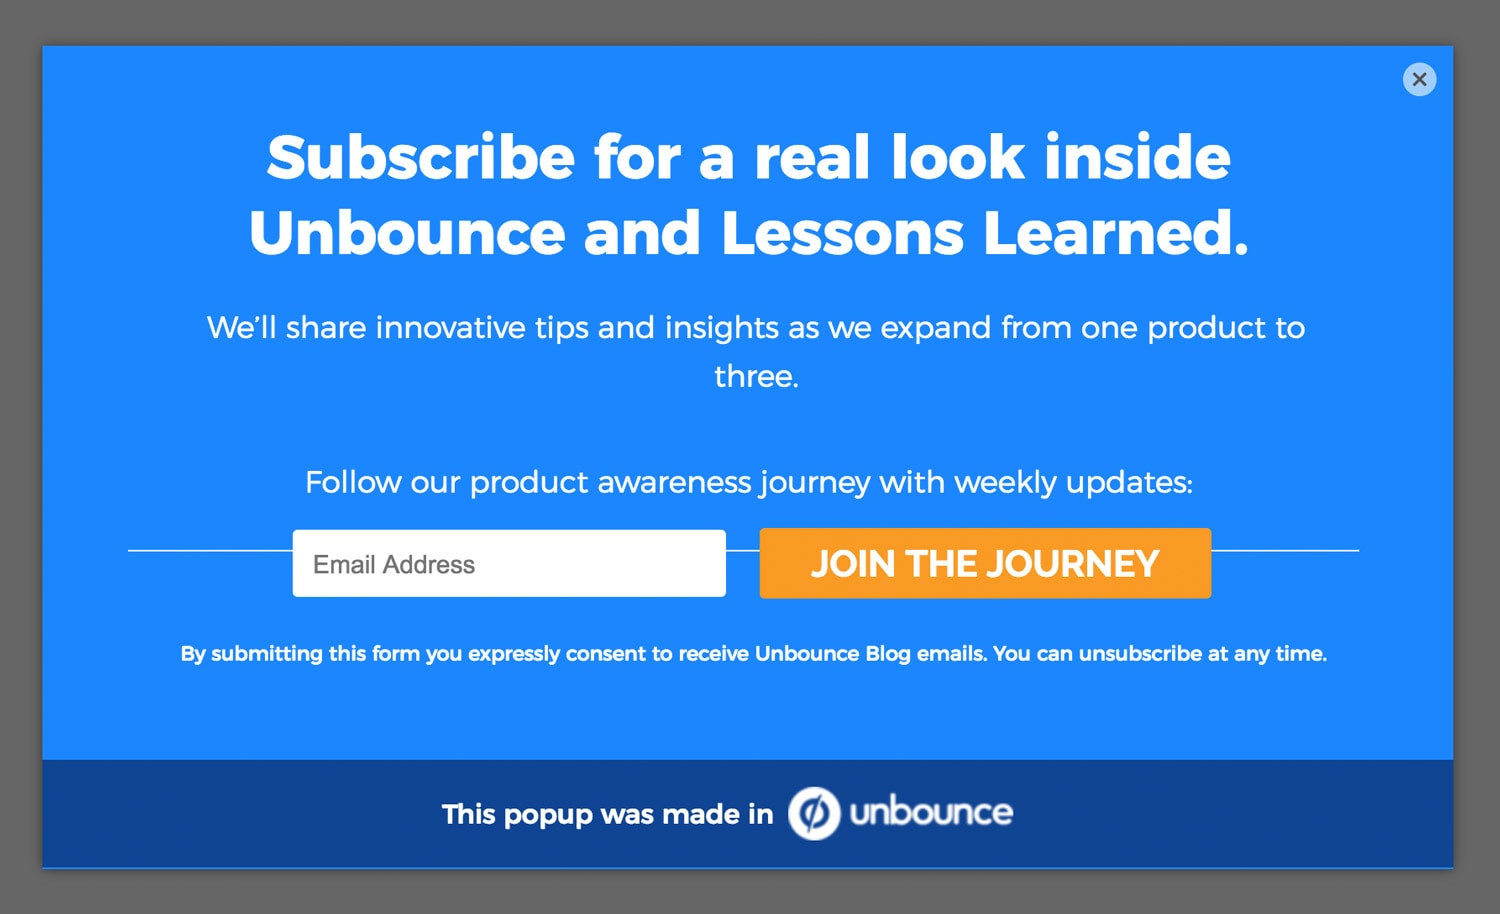
Trigger Method #1 – Exit Popup Subscribe
Exit popups are great in that almost everyone sees them, but they don’t have the intelligence to know whether the visitor was enjoying the content or not. In our experiences, the conversion rate depends highly on the perceived value of the offer.
When we give away video recordings of events we put on (webinars or conferences) the conversion rates are fantastic, between 15 and 30%.
When you’re offering a blog subscription, it’s typically in the 1-5% range. In this instance, we were offering a subscription to the blog, but the value was described as following along with our product awareness experiment, as opposed to the blog in general. Limiting the value even further.
The conversion rate for the exit popup hovered around the 2% range, dipping to 1.86% overall.
Trigger Method #2 – Click Popup Subscribe
The click trigger is the absolute best option if you want to create a valuable experience, as the popup you show is based on an explicitly expressed intent. I set up links throughout the blog posts, asking people to subscribe. When they clicked the link they got the popup.
The conversion rate for the click-triggered popup varied from around the 20% range, dipping to 15.57% overall.
So for this example, the click-triggered popup outperformed the exit popup by 722%.
Declining Conversion Rates
The reason I mention the dips in conversion rates is that I found the change really interesting. The sample sizes are not very big (120 and 52 conversions respectively), but the conversion rates held fairly steady for weeks, dropping closer to the end of the month.
This could be entirely based on sample size, but another hypothesis I had was that the motivation to subscribe was waning with every day because the value was diminished as the month went on. If you’re being asked to subscribe to a one-month content experience, and there are only 1 or 2 weeks remaining, it makes perfect sense that fewer people would care.
I can’t prove or disprove either explanation, but it’s definitely food for thought when designing time-based experiences like this.
Takeaway
It’s important to consider whether the value of your offer changes over time – either increasing or decreasing – so that you can better understand the subsequent motivation.
Insight #7 – Call to Action Clicks on Our Highest Traffic Content Page
As part of my post about the highest-traffic page you’re neglecting, I rewrote the content on our “What is a Landing Page?” page that we know receives a great deal of organic traffic.
As part of the exercise, I experimented with three options in a choose-your-own-adventure format, as a learning exercise so we can study what these visitors are actually looking for.
Option 1: “I’m new to landing pages, and want to learn more.”
CTA >> [ Watch The Landing Page Sessions Video Series ]
Option 2: “I have a landing page, but I’m not sure how good it is.”
CTA >> [ Grade Your Page With The Landing Page Analyzer ]
Option 3: “I need to build a landing page.”
CTA >> [ Try The Unbounce Builder in Preview Mode ]
When I looked at the scroll map data it showed that fewer than 50% of visitors were scrolling far enough to see the three CTAs.
So I moved them up to the top of the post, right beneath the opening description of what a landing page is – based on the fact that 86% of visitors scroll that far, and that the needs of most visitors have been met at this point (answering their question about what a landing page is).
Then I recorded the clicks that the three CTAs were getting to measure the intent and experience level of the audience. The values in the heat map below show the percentage of all clicks on the page.
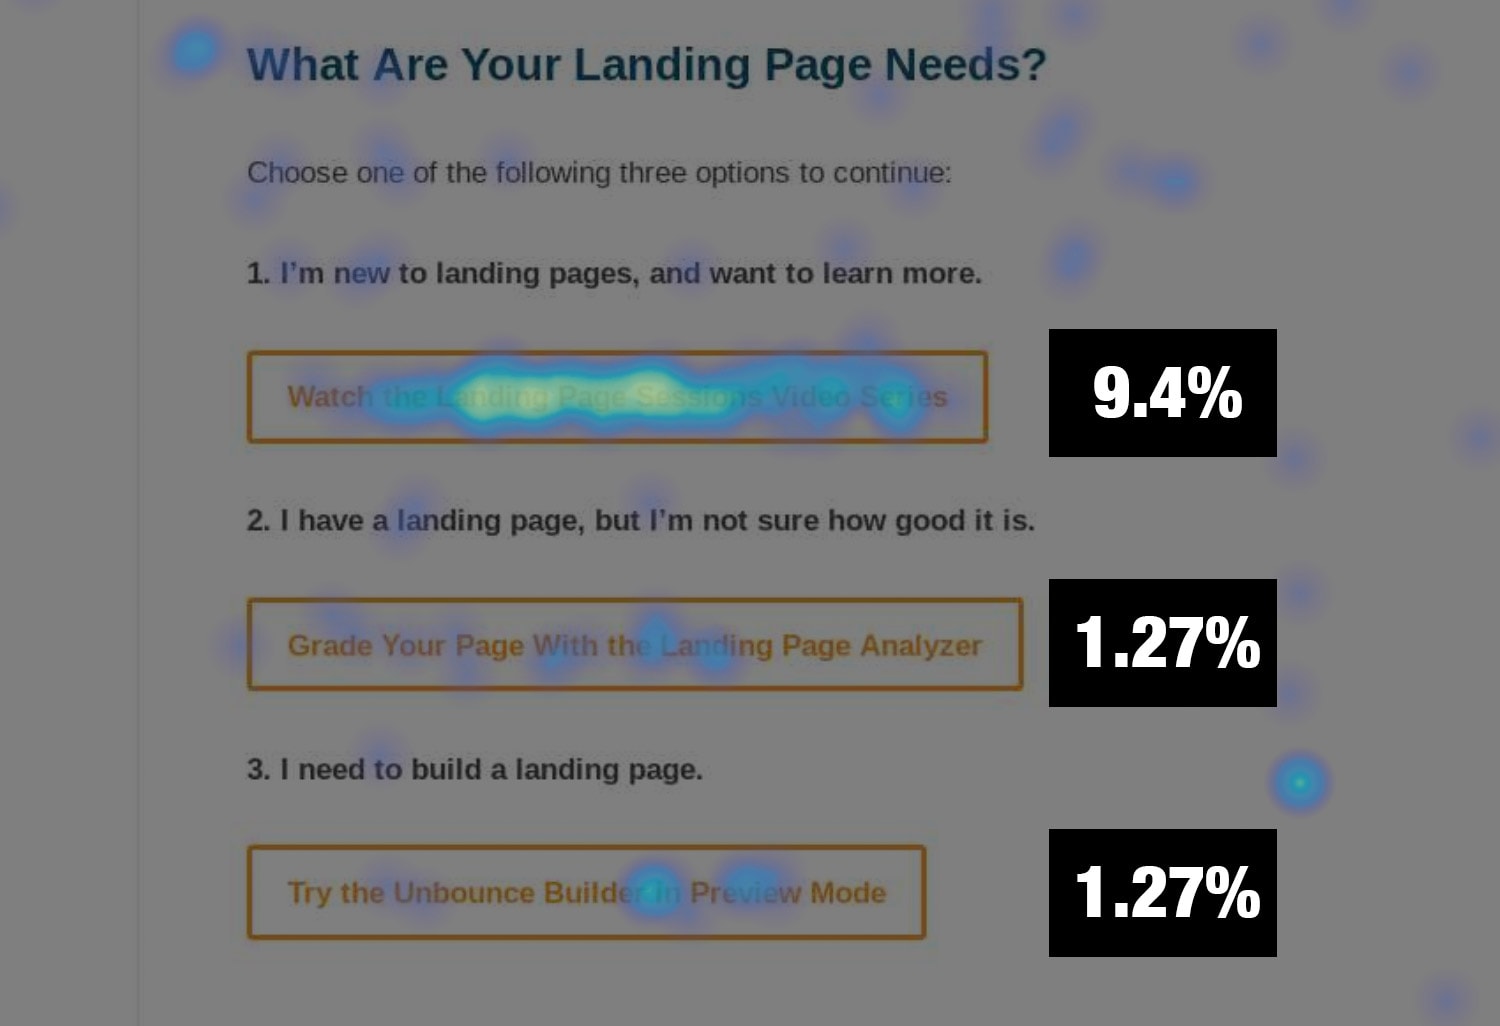
Out of 983 desktop pageviews, the numerical distribution of 141 clicks was as follows:
[I’m New: 111] [I Have an LP: 15] [I need to build an LP: 15]
It’s really clear that the beginner level CTA is most relevant to visitors to this page. Makes total sense. But when we were looking at this, Cody wondered if the order of the CTAs might be an influencing factor.
So I flipped the order and ran it for another 1,000 pageviews.
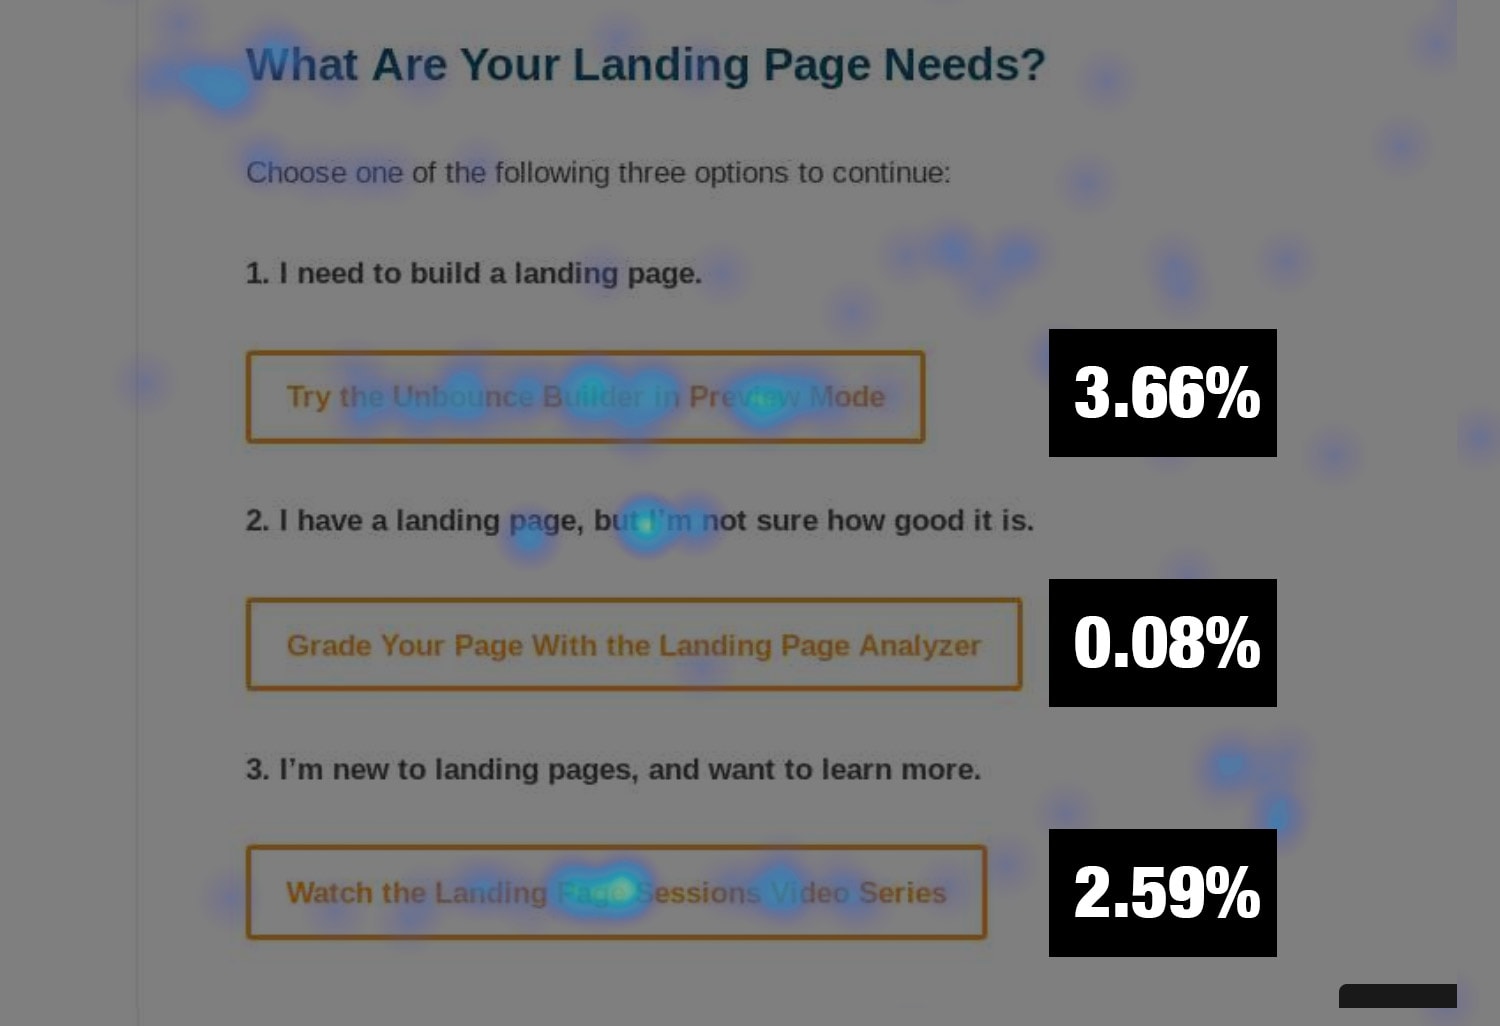
This time, out of 1,013 desktop pageviews, the numerical distribution of only 83 clicks was as follows:
[I need to build an LP: 48] [I Have an LP: 1] [I’m New: 34]
Really interesting that the number one slot retained its position as the click leader, but the overall number of clicks dropped from 11.94% to 6.33%, a decrease of 89%.
I’d like to run this again as an A/B test with a larger sample size, but my hypothesis for why the number of interactions dropped is that the first option is too aggressive for the majority of visitors to this page, resulting in them not going to the effort of reading all three options.
To add a little confirmation to the experiment, I reverted to the original order and ran the heat map again.
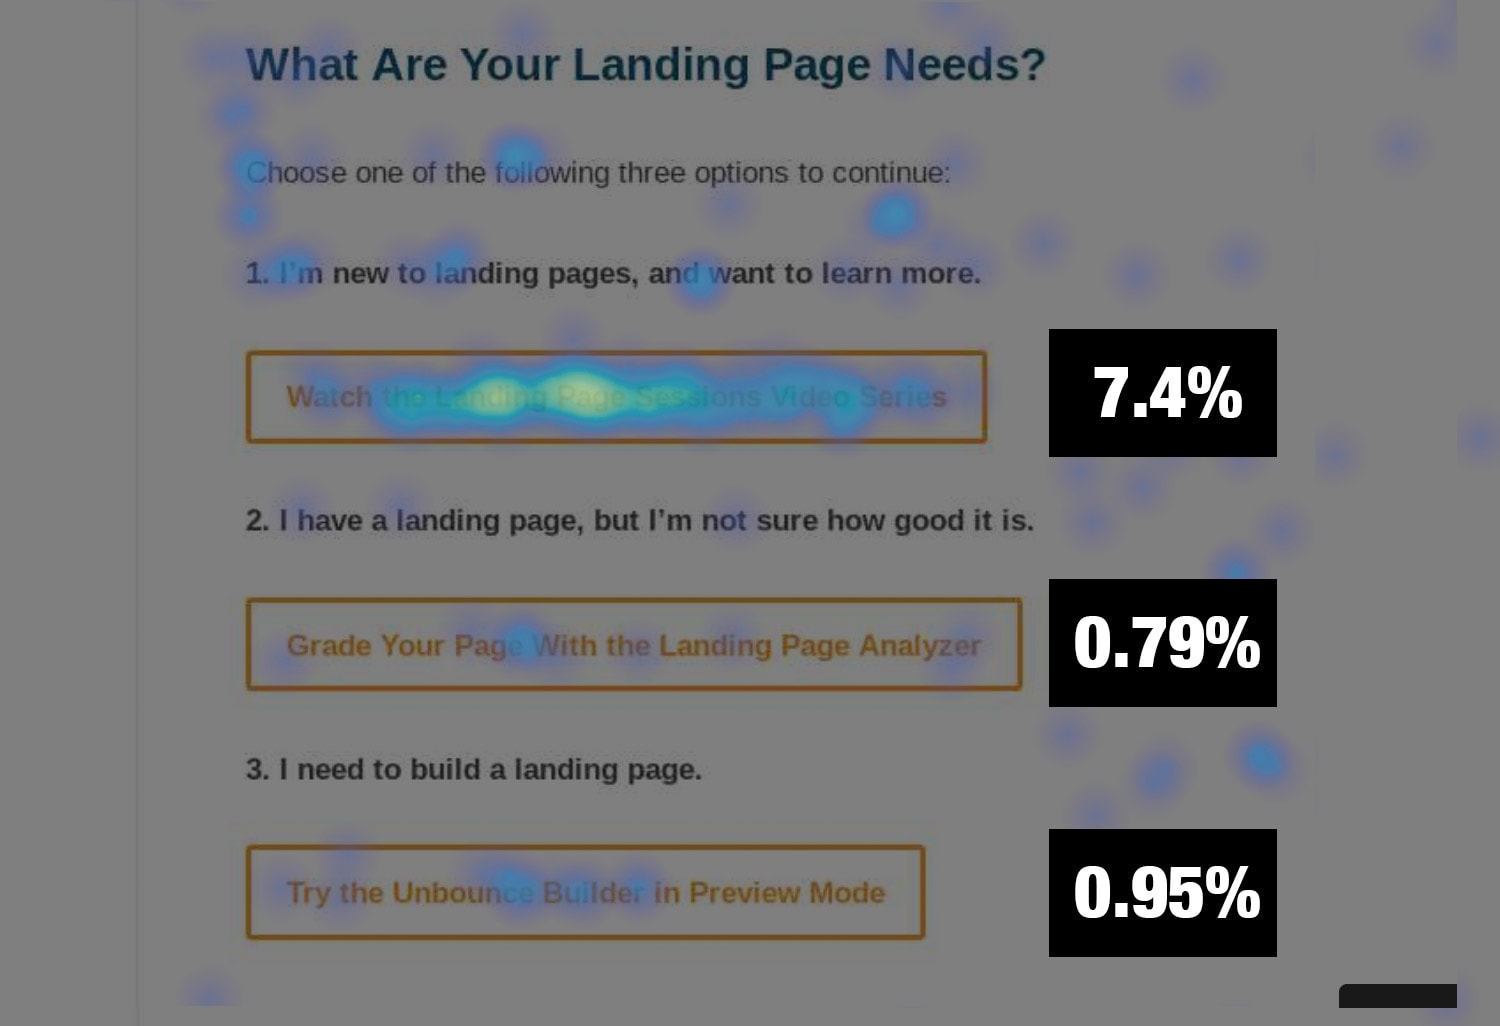
This time, out of 835 desktop pageviews, the numerical distribution of 116 clicks was as follows:
[I’m New: 94] [I Have an LP: 10] [I need to build an LP: 12]
Which is very close to the first one in terms of distribution.
Takeaway
Choose-your-own-adventure navigation is a really fun and interesting way to learn about the intent of your visitors, and the order and magnitude of the action you’re asking people to take can influence how much interaction takes place.
Fascinating stuff!
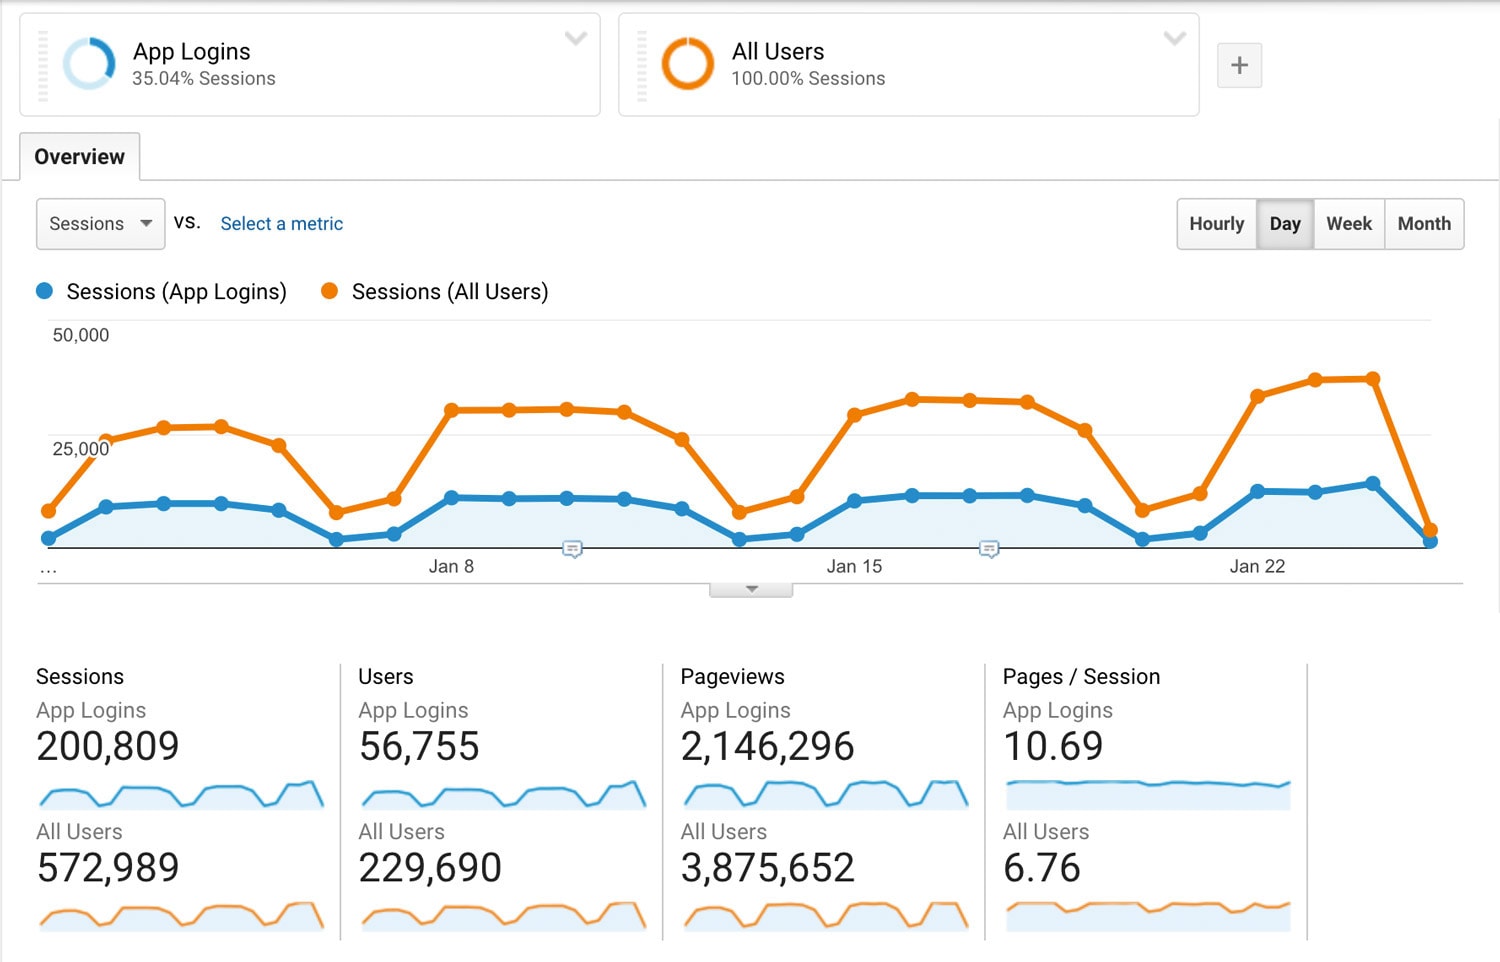
Insight #8 – SaaS User Login Visits
This one is a bit tangential, and came to me when designing The Login Hijack concept in my post about cool use cases for popups.
For SaaS businesses, it’s very common for people to visit your website for the sole purpose of logging in to your app, and if you don’t take this into account your metrics can be way off.
You can see that for Unbounce 35.04% of website sessions are used to log in to the Unbounce app.
I reached out on Twitter to inquire about the numbers at other SaaS companies and found a lot of similarities:
- Stefan Debois reported that for SurveyAnyPlace.com it’s 45% of homepage visits
- John Bonini from Databox shared that their number is 28%
- Jon Davis from Shape.io reported a number of 30%
All of these numbers represent significant potential for incorrect reporting, and opportunistic product marketing to your customers who are showing up for this reason.
Takeaway
I ran a Twitter poll to extend the question:
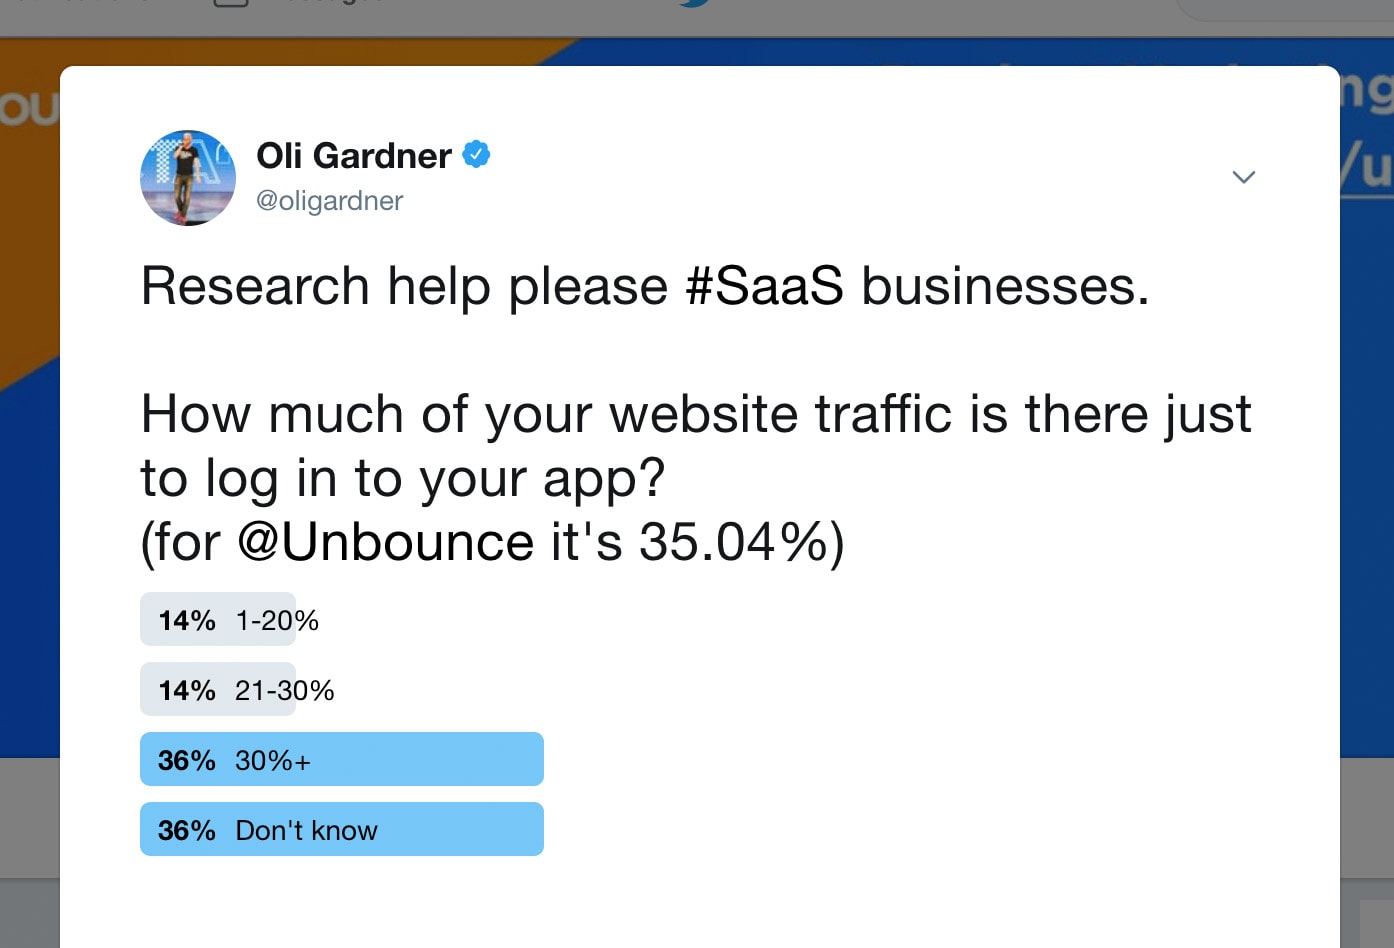
What’s particularly interesting is that the majority of people who answered don’t know. We all need to know this number. Go find yours and report in the comments.
Insight #9 – Product Awareness and Adoption Data
In this section I’ll cover the levels of awareness increase based on three segments of people:
- Visitors: new folks coming to unbounce.com who have never used the product
- Users: those with an Unbounce account of some type who have not paid us three times
- Customers: those who have paid us three times
Insight #9a – Product Awareness: New Visitors
Looking in GA, there were 8,036 new visitors who were exposed to the new Product Awareness Month content – who were not current users or customers.
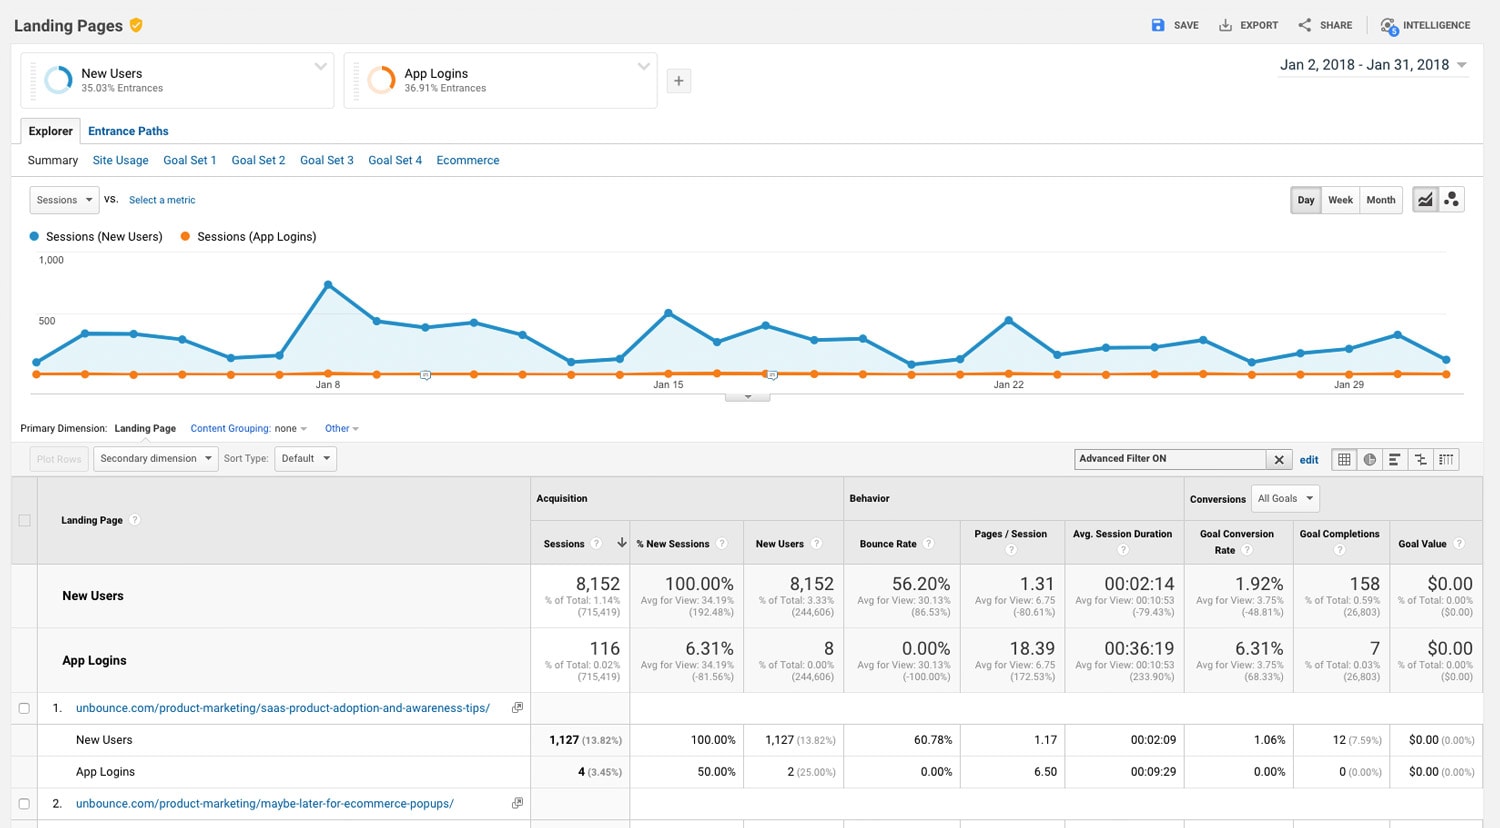
This will be an interesting chart to follow over time to see which content continues to produce organic traffic.
Looking at Kissmetrics we can look at the cohort who have reached a product touchpoint including documentation, features pages or campaign landing pages specific to popups and sticky bars (but not the new PAM content):
Visitors have seen awareness content (excl. PAM)
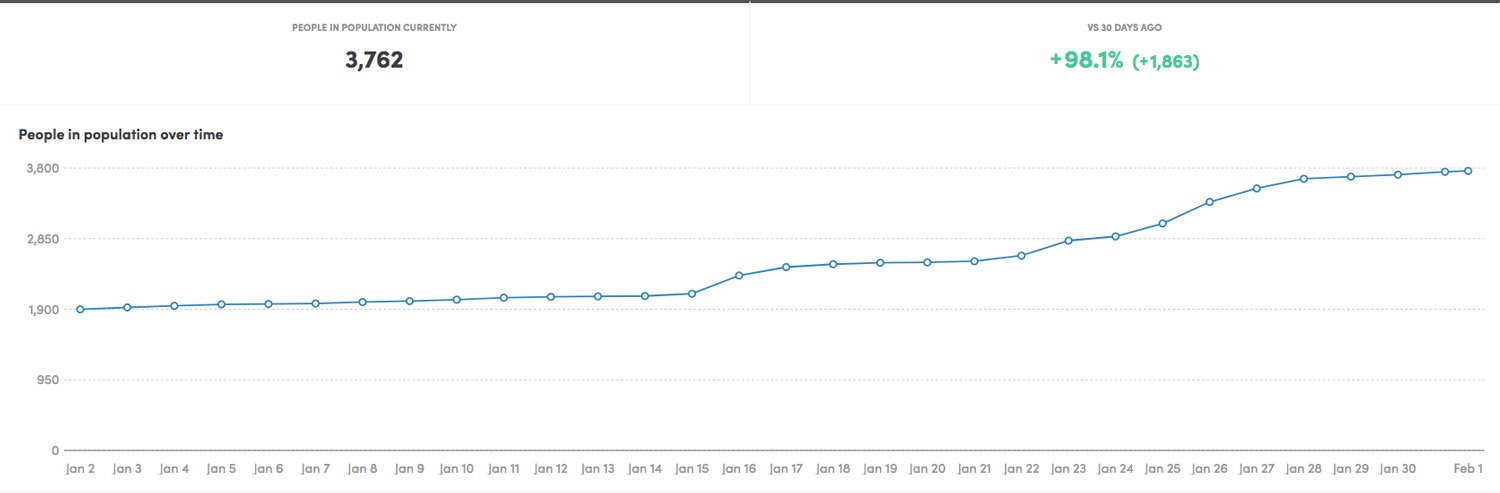
Visitors have seen awareness content (with PAM)
These are visitors who have found their way to the product touchpoints AND also saw the PAM content.
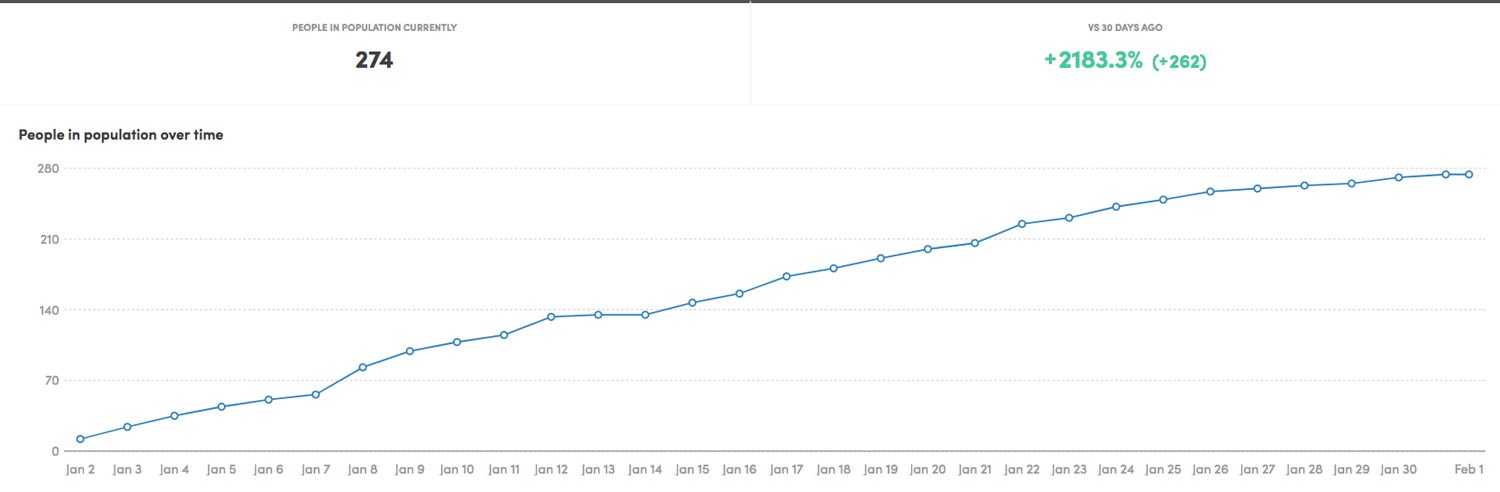
What this shows us is that 274/3762 = 7.3% of total new aware visitors in January came from the Product Awareness Month content.
Insight #9b – Product Awareness: Users
Let’s use a different lens for a moment. The previous section was an analysis of Unbounce customers based on our definition of a customer being someone who has paid us three times.
But what if we look at overall users?
Our user count is much larger than the customer count because it includes those still on their free trial as well as plans like free / student / startup / not-for-profit.
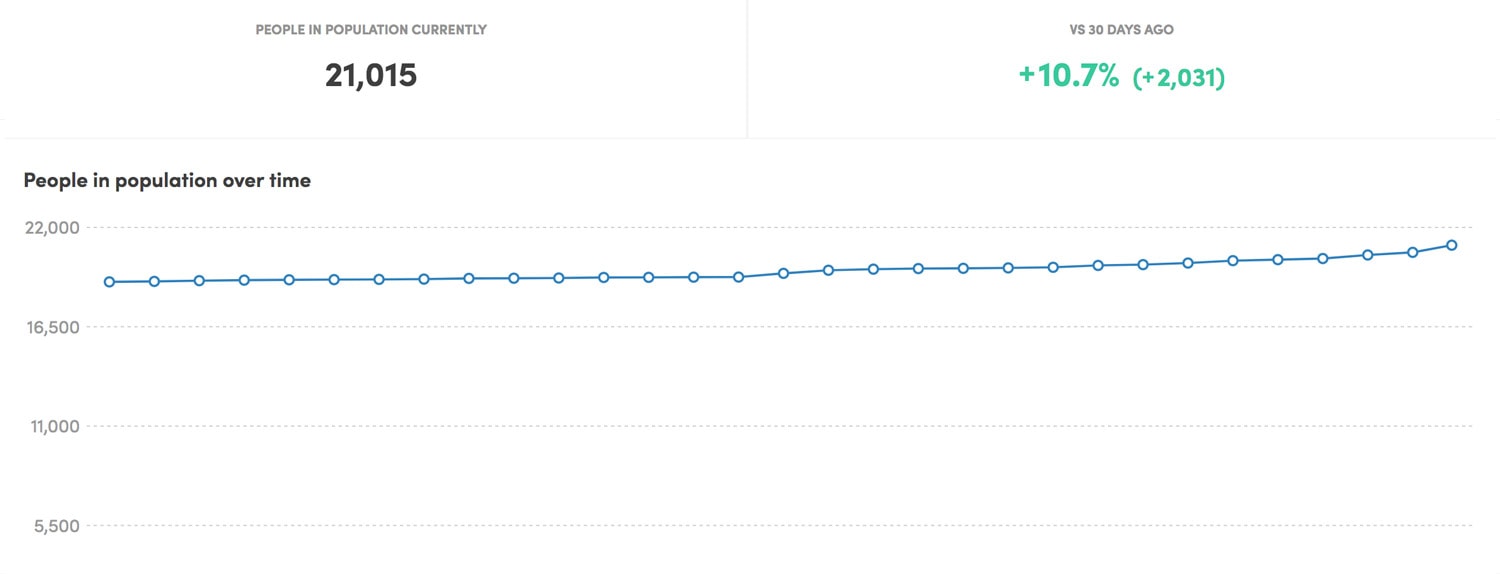
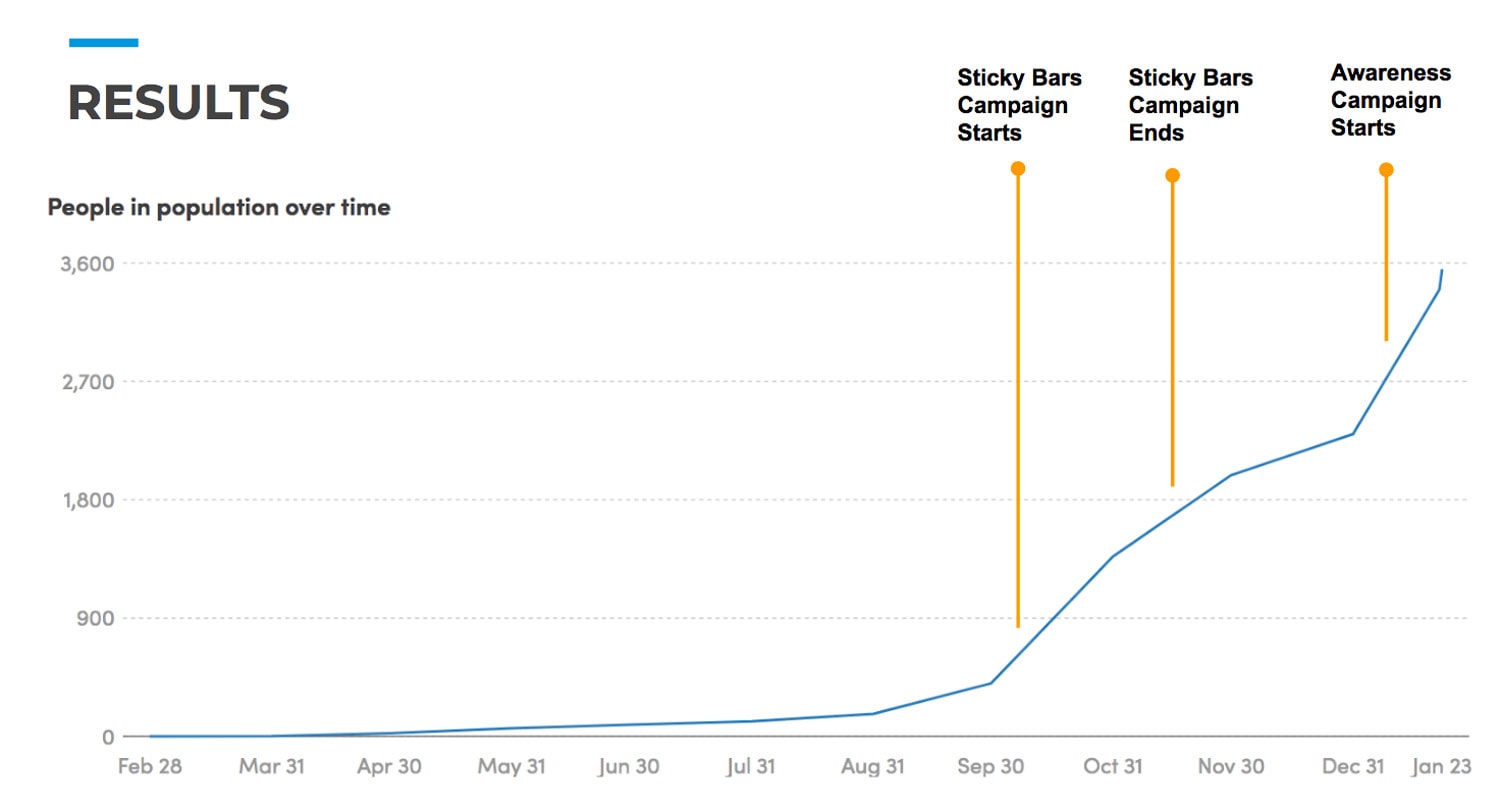
In the past 30 days, changes in product awareness look like the chart below. That’s an increase of 2,031 people (10.7%) in the total population based on the activities and campaigns of the awareness squad.
Now if we include folks who’ve seen the Product Awareness Month content, the number rises by an additional 374 people.
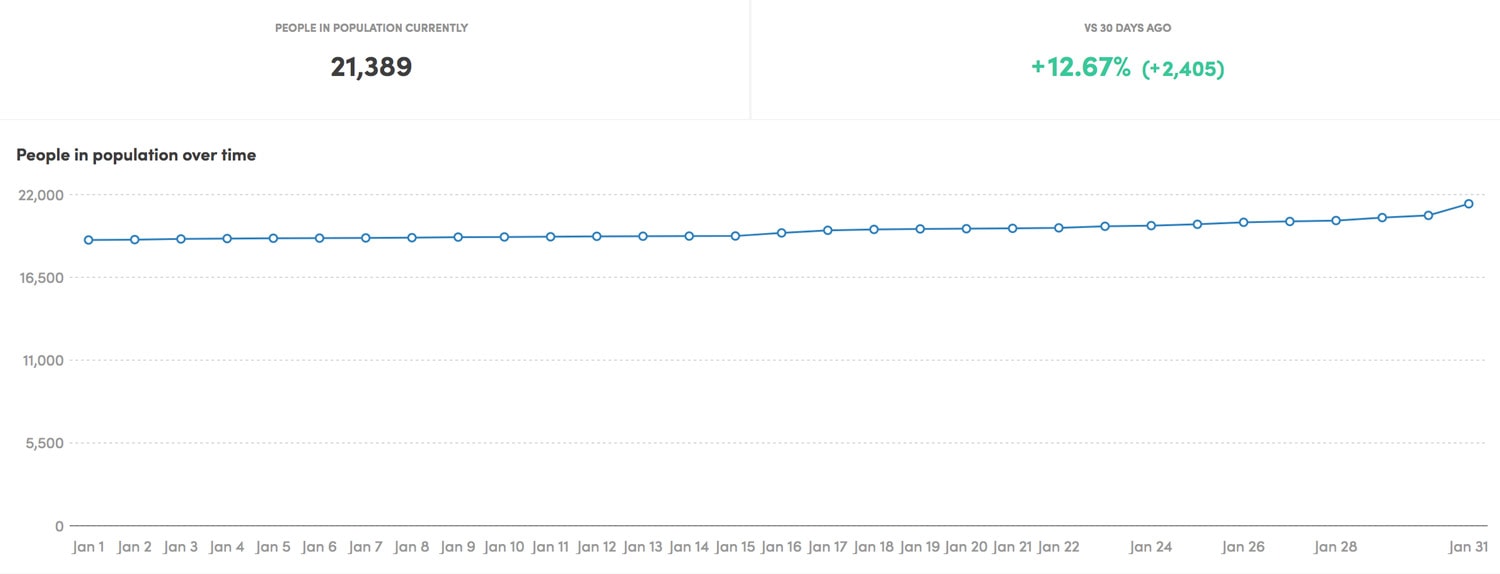
In essence, what this tells us is that the Product Awareness Month content contributed 18.4% of the total user awareness increase in January.
That’s pretty damn cool. And because it’s content, it will continue to live on and continue to increase awareness. At least the portions that speak to search intent, and those that inspire backlinks.
Insight #9c – Product Awareness & Adoption: Customers
When we first began marketing popups and sticky bars we were focused on both prospects and customers. But adoption is largely dependent on customer awareness of the products, and so one of our teams in Customer Success got to work.
Knowing awareness was the goal, they launched a campaign designed to make sure our customer base knew we weren’t just a landing page builder anymore.
They created an epic video, embedded it on this landing page, and ran their campaign, which included redesigning our login screen to take advantage of a placement every customer sees multiple times:
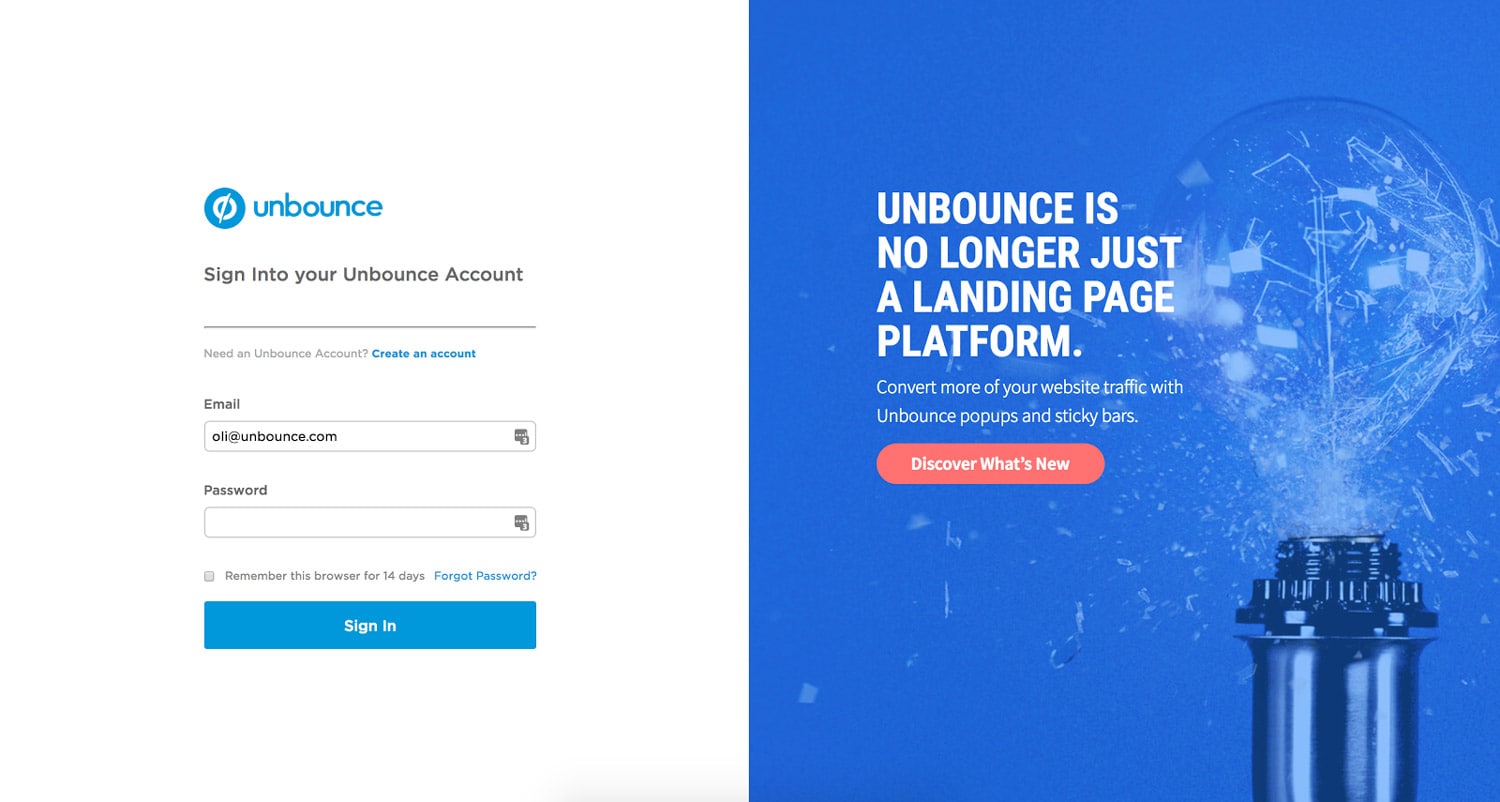
The results? The team’s had 3,473 visits to the landing page (about 27% of our active customer base) and 52,603 views of the new login page ad above.
For the purposes of this campaign, the team defined “aware” as anyone who had reached a product touchpoint including documentation, features pages or campaign landing pages specific to popups and sticky bars.
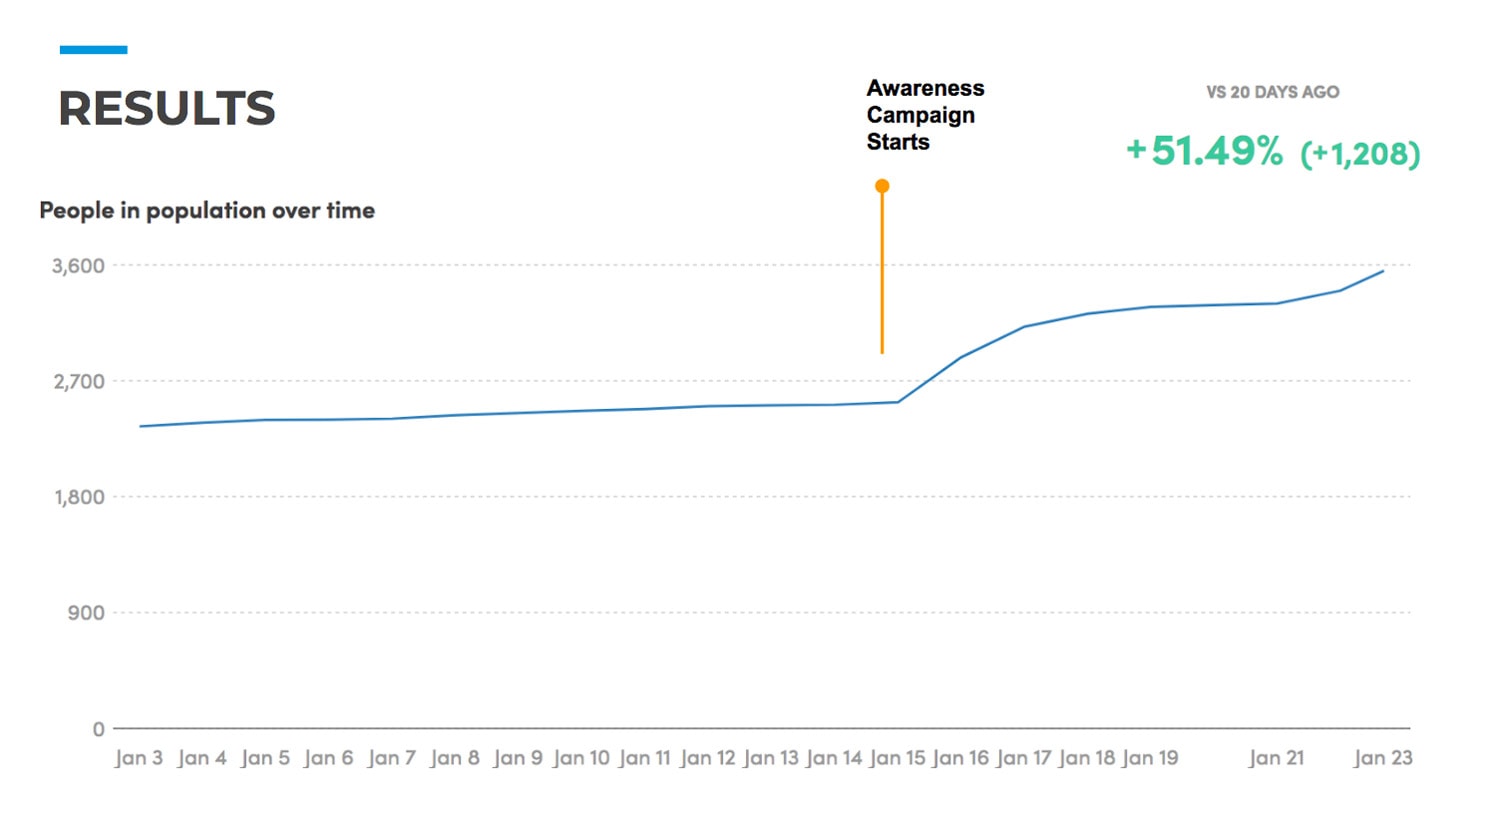
The data below represents awareness changes over time as defined above. It currently doesn’t filter for customers only, but does include criteria that someone has accessed the builder in addition to the other touch points aforementioned:
As you can see, corresponding to the launch of two major customer campaigns, there has been a steading increase in encounters with these touchpoints, and thereby awareness.
There has been a 51.49% increase in awareness in just the first week following the launch, as seen in the day-by-day view below:
Regarding adoption, our product adoption funnel looks like this in simple terms:
Created -> Published -> Installed -> Evaluated -> Adopted
The chart below shows the growth of the various stages since we launched the limited beta at the end of 2016.
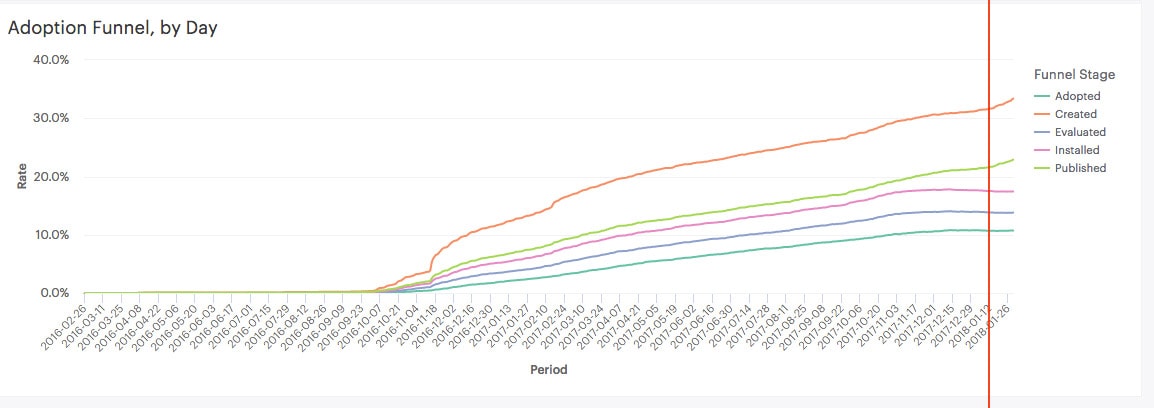
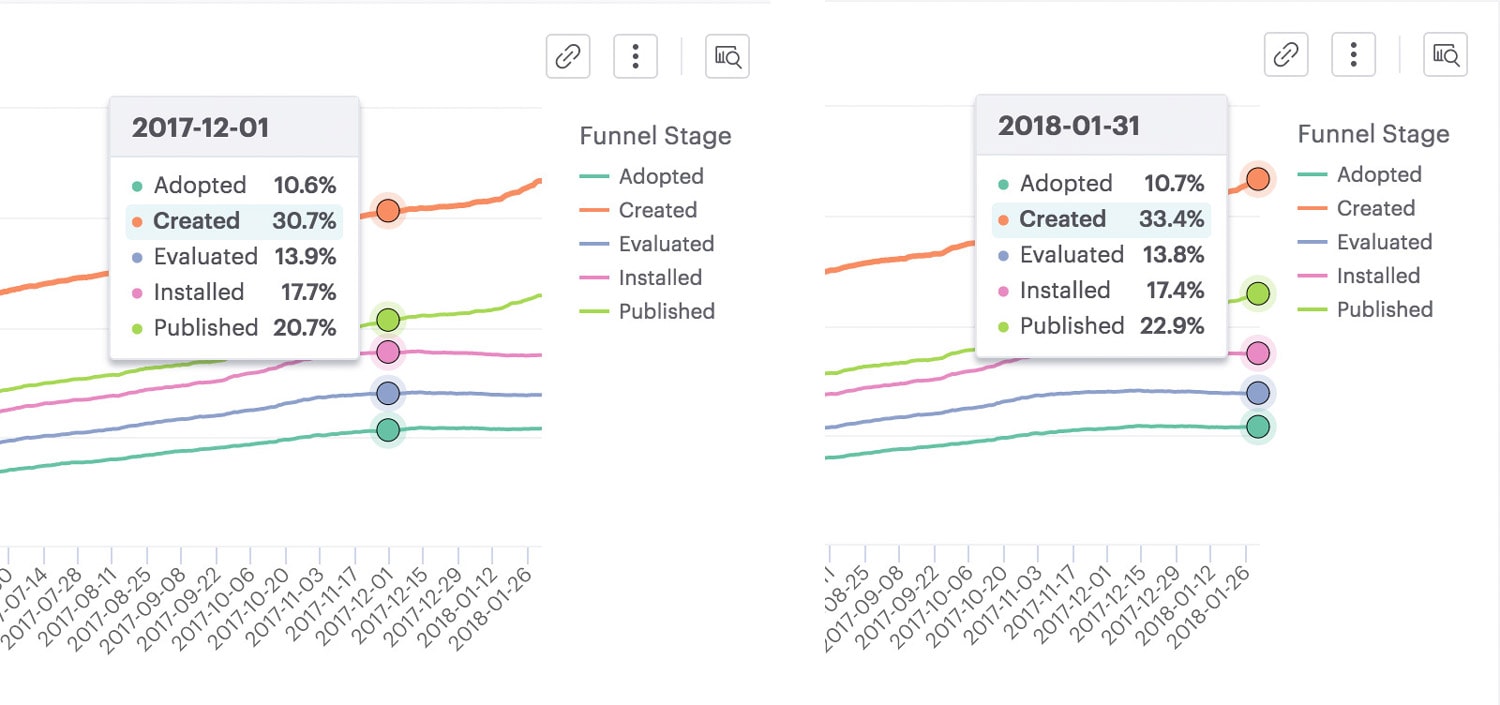
Zooming in below, you can see that some of the adoption funnel metrics are a bit flat, but the exciting thing is that the number of popups and sticky bars being created and published is showing a great improvement which will naturally lead to adoption. And it looks like the lift started right around the time of the January 15th campaign launch.
We have a phase 2 campaign going out soon focus on driving people all the way through the adoption funnel, which will hopefully amplify these early successes.
Takeaway
While the blog could work to increase awareness with those who’ve never heard about us, customer campaigns were still very necessary for popups and sticky bars and we discovered loads of spaces within our product where we might draw more attention to new products (like login screens and certain empty states). It’s early days yet, but we’re already starting to see the effect the above campaigns are having on awareness within the customer base.
Insight #10 – How Many Words Did I Write?
Including this post my tally sits at around 37,000 words.
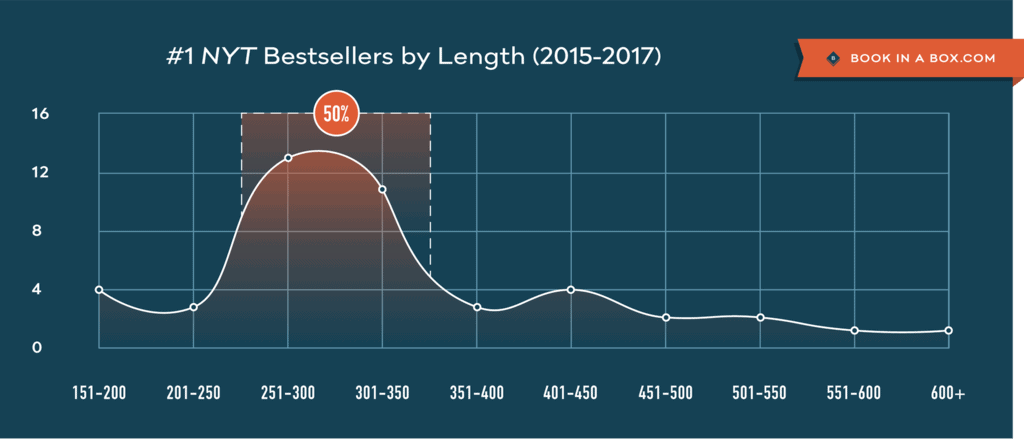
According to research into the page count of recent NYT bestsellers list books, 300 pages is about the right length. At an average of 250 words per page, that totals 75,000 words.
Basically, I’m halfway to having people read about popups and sticky bars on a plane, in my book they bought in an airport bookstore.
Takeaway
Write 20 more posts then stick ‘em all together and call Wiley and Random House.
Insight #11 – The Impact Quantity Has on Quality
I put out some seriously awesome content this month. Stuff I’m really proud of in terms of creative thought and interaction design. But there’s one thing that’s missing (I think) from the writing, once I started to get tired from all the writing.
I lost my edge in terms of personality and humor.
It just wasn’t possible to write that many posts, with that many words, and find a way to make it as entertaining as I expect my content to be. But that’s because there were no second drafts, no editing, virtually no QA on mobile. It was always a 2am battle to finish the day’s post to publish it before I went to bed.
Add. Rinse. Repeat.
Another important factor was that because I was so rushed, and creating so much content, I had no time to do any image optimization. There are no alt or title tags on the images and links, so there’s a big missed opportunity for image search. Having an extra day per post, would have made a big difference.
Takeaway
I love the quantity. I guess I’m vain that way, but if we want our content to live on past the typical 3-5 day window that blog posts have to be seen, then they either have to be so special that everyone links to them, or so on point with the search intent of your ideal customer that it’s find time and time again.
One of the biggest drivers of traffic to our blog from organic search is to a post about email subject lines, which has absolutely nothing to do with our target audience. We used to have a very broad full-stack breadth to our content which was great, it has a ton of value. But it doesn’t attract our ideal customer, which makes it a waste.
Tough lesson learned. We’ll be focusing our content (aside from this month’s insanity) in a much more targeted manner this year, and I’m excited to see how much of an impact it has on our key metrics.
Insight #12 – What Should I be Writing About Next?
I’ve learned a lot in the past 30 days about what is and isn’t important when it comes to impactful content, and I’m re-energized to continue creating value for our now and future customers. But what form will it take?
Based on the highest organic traffic content, there are two places that need an urgent overhaul:
The Landing Page Conversion Course (LPCC)
The Landing Page Conversion Course has always been great at attracting traffic, however, it’s very out of date, and the product videos are now 5 years old and not representative of what Unbounce has become as a product. It was also purposely targeted at top of funnel signups for our old free account. The focus of the new iteration will be much more targeted at NTS and getting much higher value from the content.
The landing page articles section
The landing page articles section is sooooo old. I wrote it in 2010 and only managed to rewrite one page of it this month (as part of insight #7 above). It’ll be great to freshen this up and provide better value for all those visitors looking for help with their landing page learning.
How do I Feel About Product Awareness Month Now?
Honestly, I don’t think I’ve felt so exhausted at any point in my professional career. This was a barn burner of a month. But it’s been such a rich and valuable journey for me, both as a marketer, and a co-founder. Hopefully it’s also been enriching for those who have followed along throughout this crazy experiment.
What’s next? Well before I dive into those two other projects, I need to get my butt to Mexico for a brief honeymoon with my beautiful bride Nicole. My plane leaves at 10:30am.
Adiós amigos! See you in a week.
Cheers,
Oli Gardner
