COVID-19 Pandemic
Did COVID-19 Change Digital Marketing Traffic?

COVID-19. Pandemic. Those are two words you won’t find anywhere else in this report. That’s because insights related to the effects of COVID-19 on digital marketing in 2020 aren’t especially useful to you today—and the Conversion Benchmark Report is all about highlighting new opportunities to optimize your campaigns today.
But the reality is that every insight in this report has been influenced by the pandemic because it was happening as we collected our data. And even if this information isn’t super actionable for marketers now, it’s intriguing. You wanna see it.
So, here it is. To try and get a sense of how COVID-19 impacted digital marketing, we compared two sets of online traffic data: one from before the pandemic (August to November 2019) and one smack-dab in the middle (August to November 2020). Then we looked at how traffic patterns to your landing pages have changed.
Interpreting The Insights
First, a quick discussion on confirmation bias.
Whether you’re part of a fitness team that had to move classes online or you run an ecomm that fluked into record sales, the data shows that people engaged differently with your business in 2020 than they did in 2019. One problem: It’s really hard for us to say definitively that these changes are because of the pandemic.
You can speculate. When you see that one industry got a ton more traffic last year, or another industry got way less, it’s easy to think about how the health crisis could be responsible. But this data doesn’t tell us everything. It gives signals, but we can’t connect these insights to COVID-19 with absolute certainty.
Keep that in mind as you review the insights below.
Key Insight: Overall Industry Traffic
Overall visitor counts increased—but that doesn’t tell the whole story.
So, what do we know for certain?
Let’s start high-level. Between 2019 and 2020, we observed growth in overall traffic for nearly every industry. Check out the graph below to see the percentage change between our two data sets.
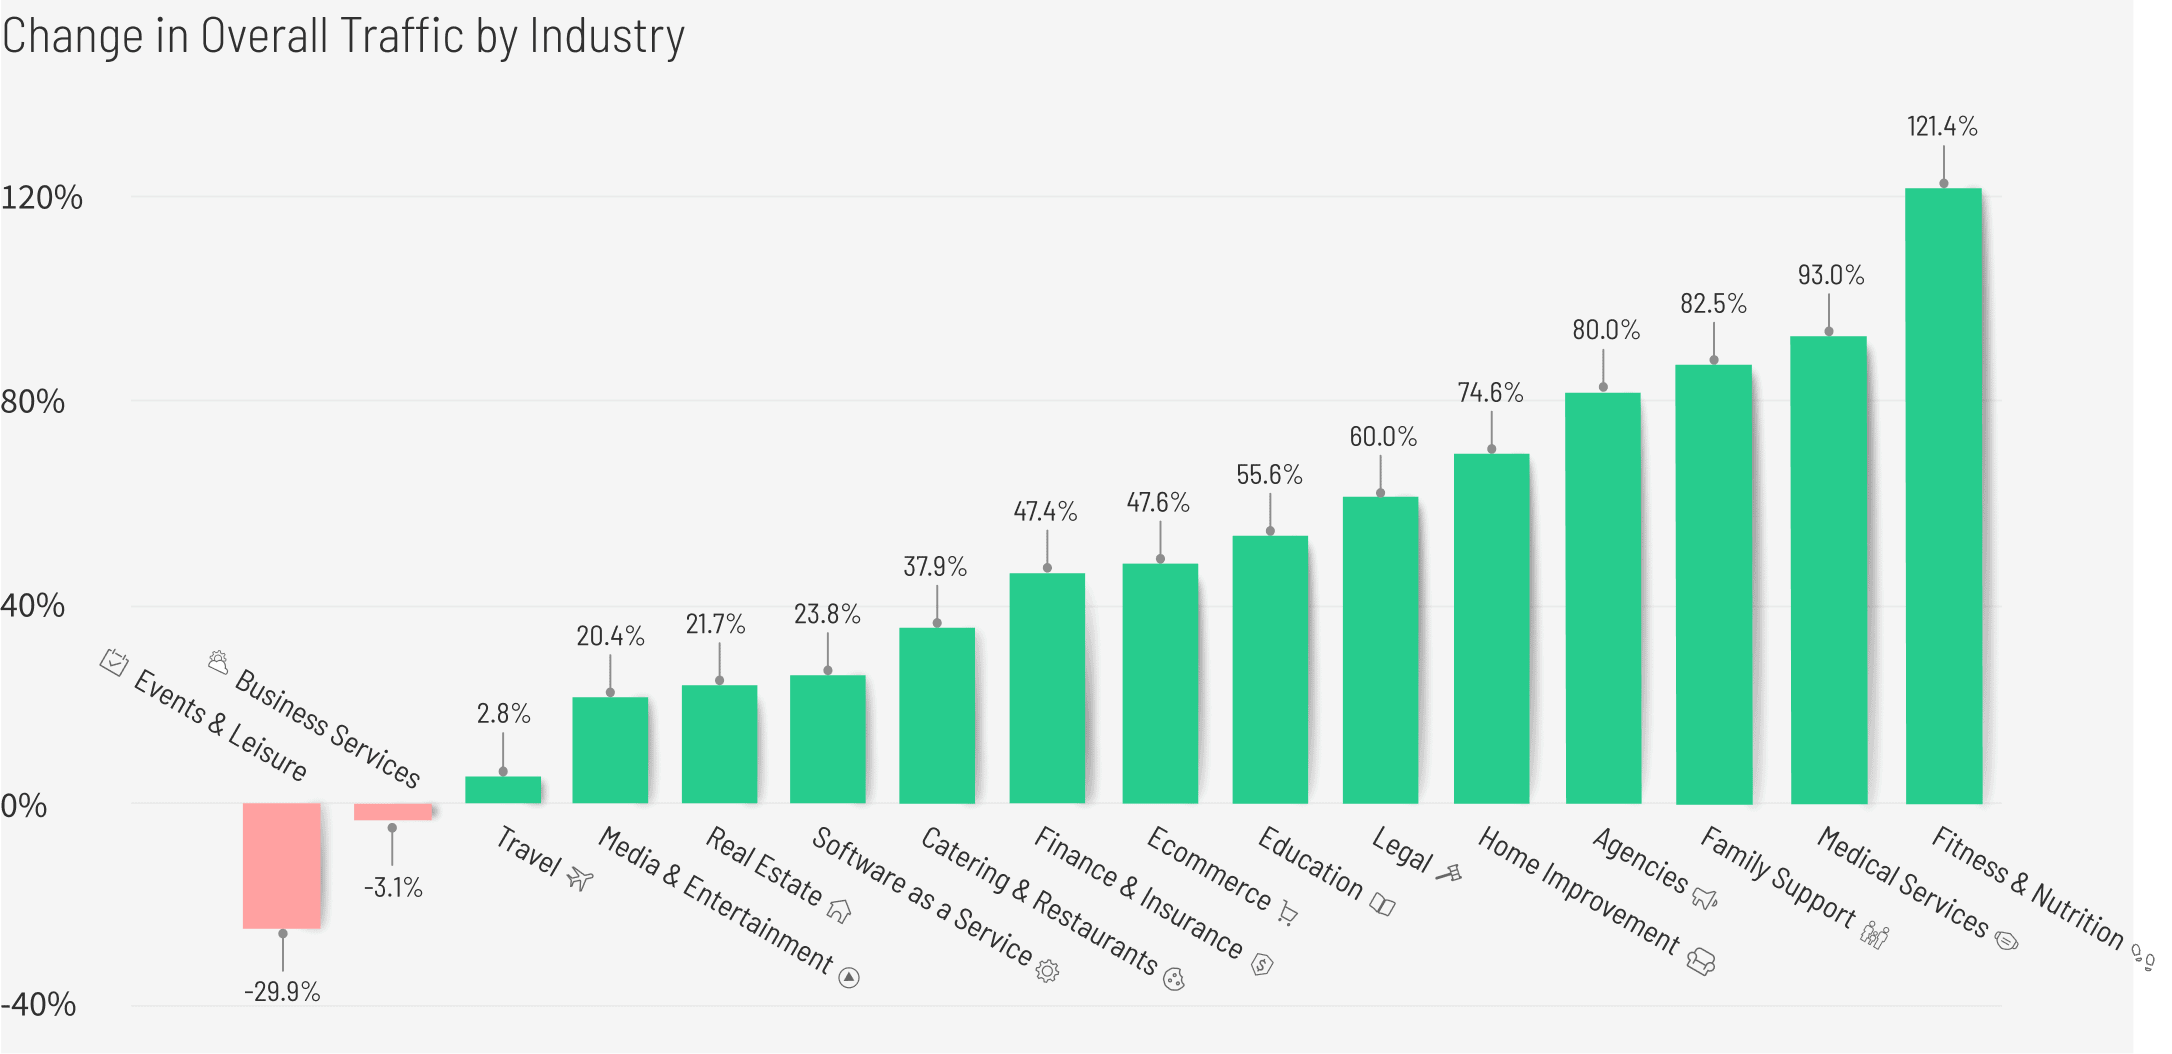
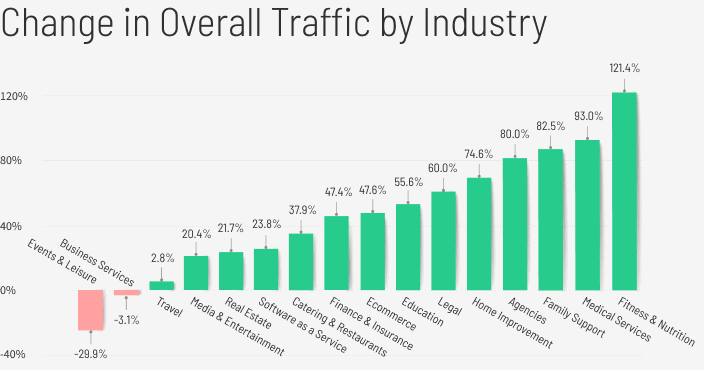
The health and wellness industries grew significantly over the past year. Fitness and nutrition (+121.4%), medical services (+93.0%), family support (+82.5%)—all of ‘em saw big increases in overall traffic. Meanwhile, businesses offering in-person events and leisure activities had far fewer total visitors in 2020 than in 2019 (-29.9%).
Ecommerce and real estate are two segments that boomed during the pandemic—one expectedly, the other… mmm, not so much. And while both industries saw their traffic grow last year (+47.6% and +21.7%, respectively), it’s not to the extent we might’ve guessed.
But overall traffic is just part of the picture. It doesn’t tell us how many visitors each landing page is getting, and that’s a better measure of how things have changed for marketers on the ground. (Or rather, on their couches working from home.)
Accelerate results with simple CRO
Access the full Conversion Benchmark Report for detailed industry benchmarks, in-depth conversion rate insights, top-performing channels, and more.
Key Insight: Median Page Traffic
Landing page traffic is up for everyone (despite some marketing cutbacks).
To figure out whether pages are (generally) getting more or less visitors, we first compared the number of active pages in each industry in November 2019 and November 2020.
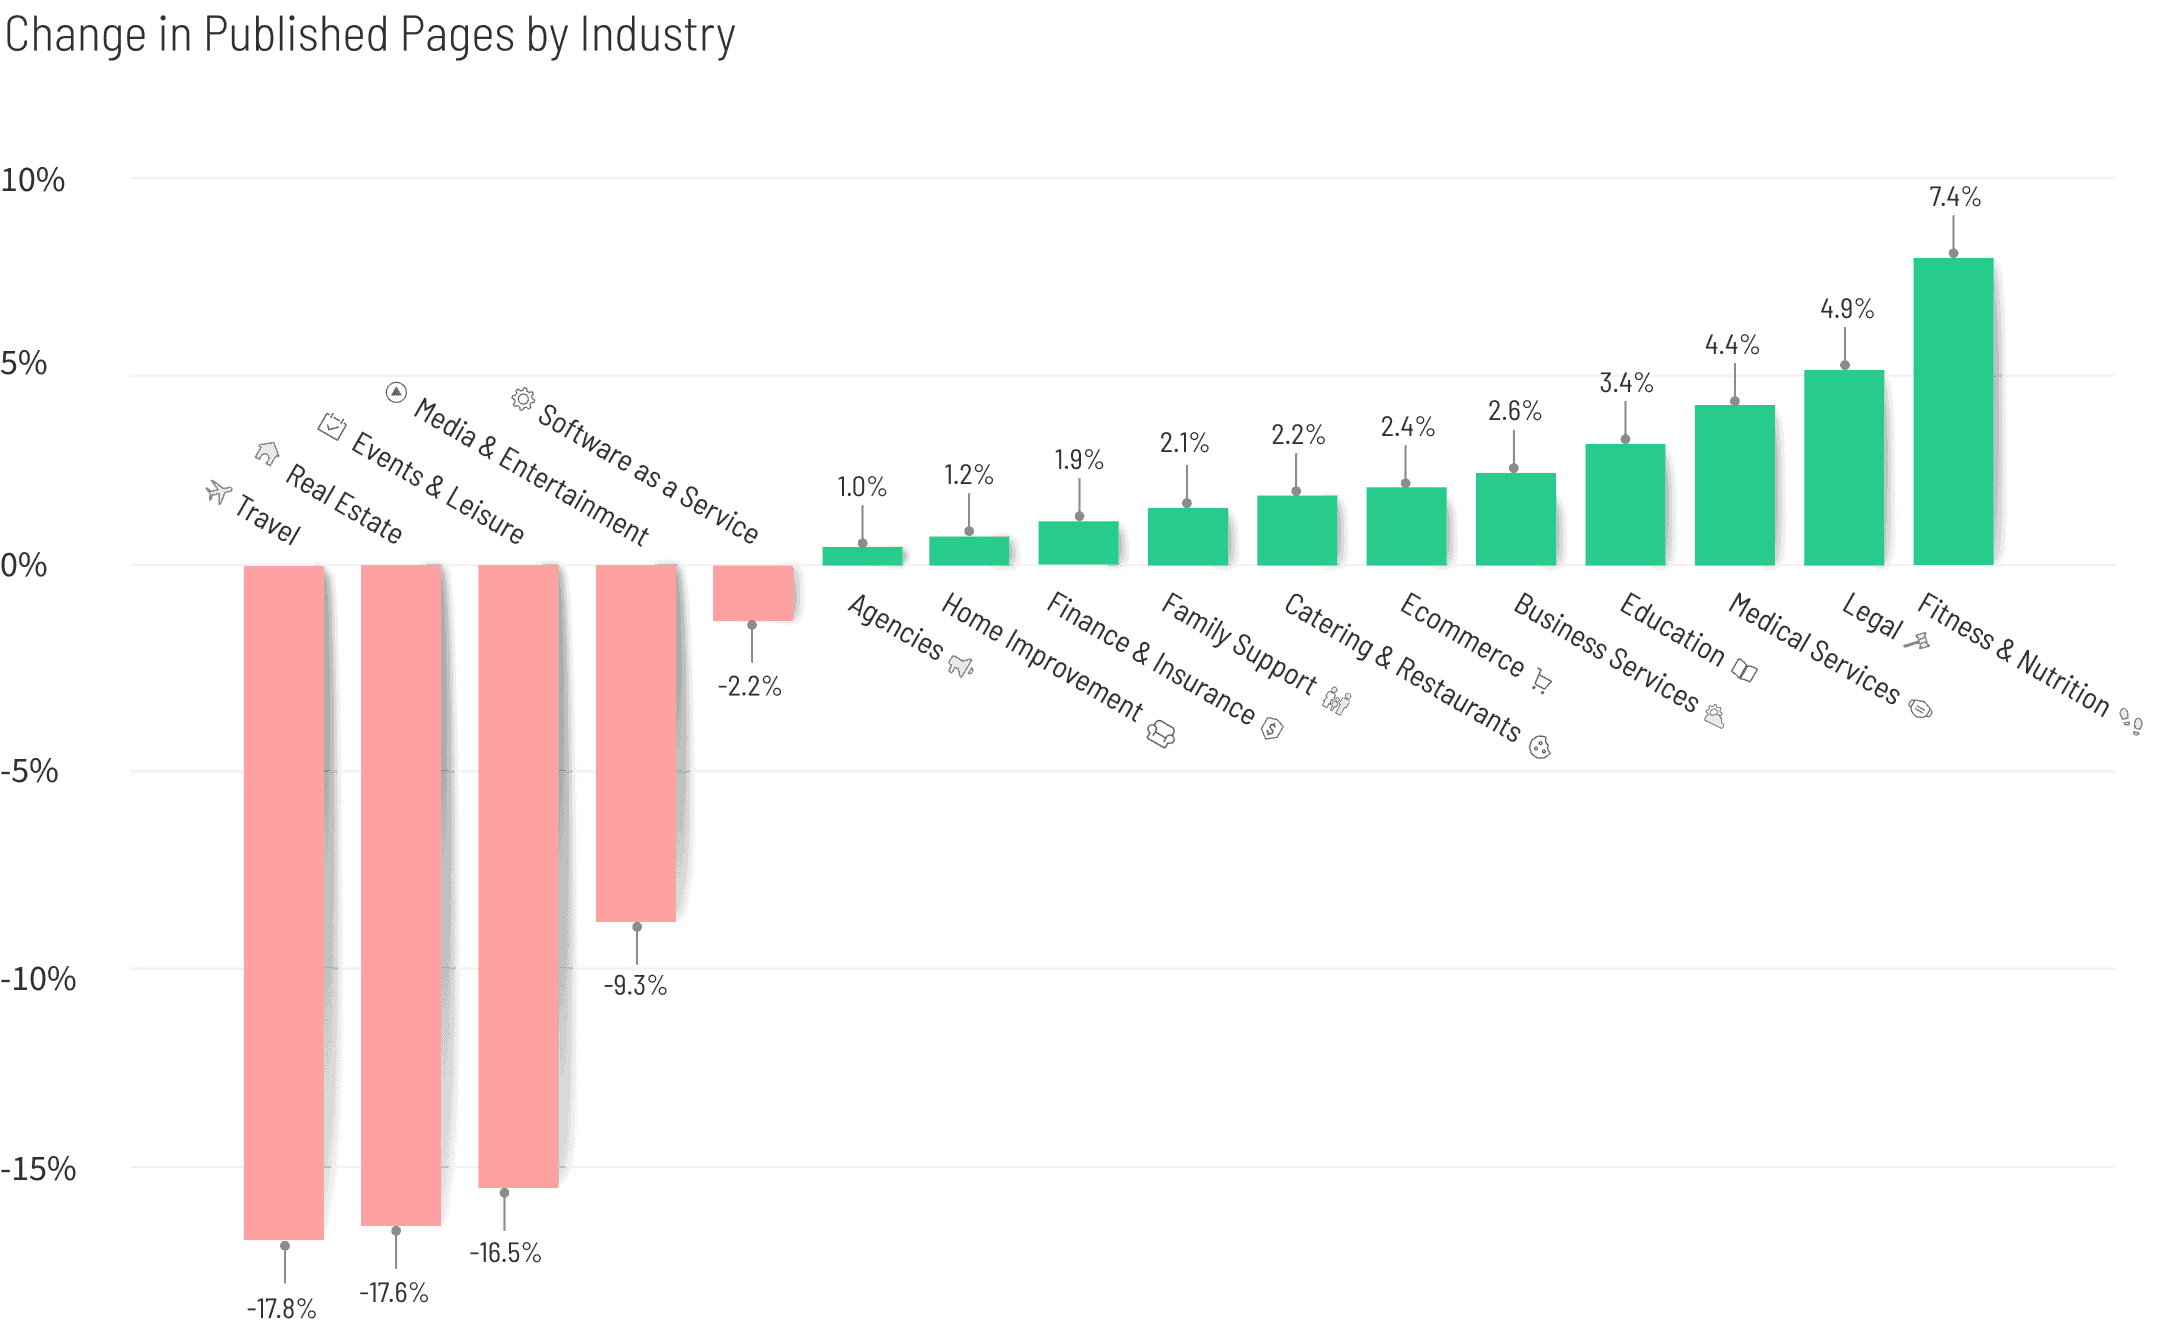
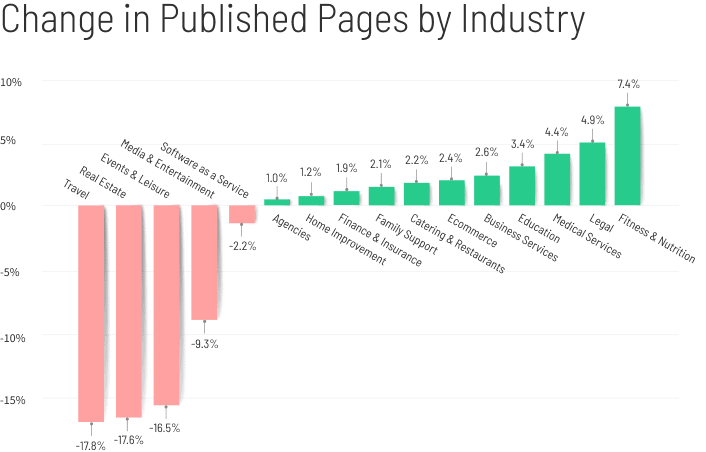
We found that most segments had more active landing pages last year than they did before the pandemic—with a few notable exceptions. The travel (-17.9%), events and leisure (-16.5%), and real estate (-17.6%) industries all saw double-digit decreases in their number of published pages.
The first two don’t exactly come as a surprise, given that restrictions on movement and assembly meant vacations and concerts became the stuff of daydreams. (Aruba, Jamaica, ooh…) Real estate is a bit of a quirk, though. We mentioned earlier that home sales surged in 2020. Maybe the market was so hot that agents dialed back their digital advertising? Your guess is as good as ours.
Next, we looked at how median page traffic changed for each industry in 2020. This also reveals something surprising: every segment saw growth in the number of visitors a page typically gets.
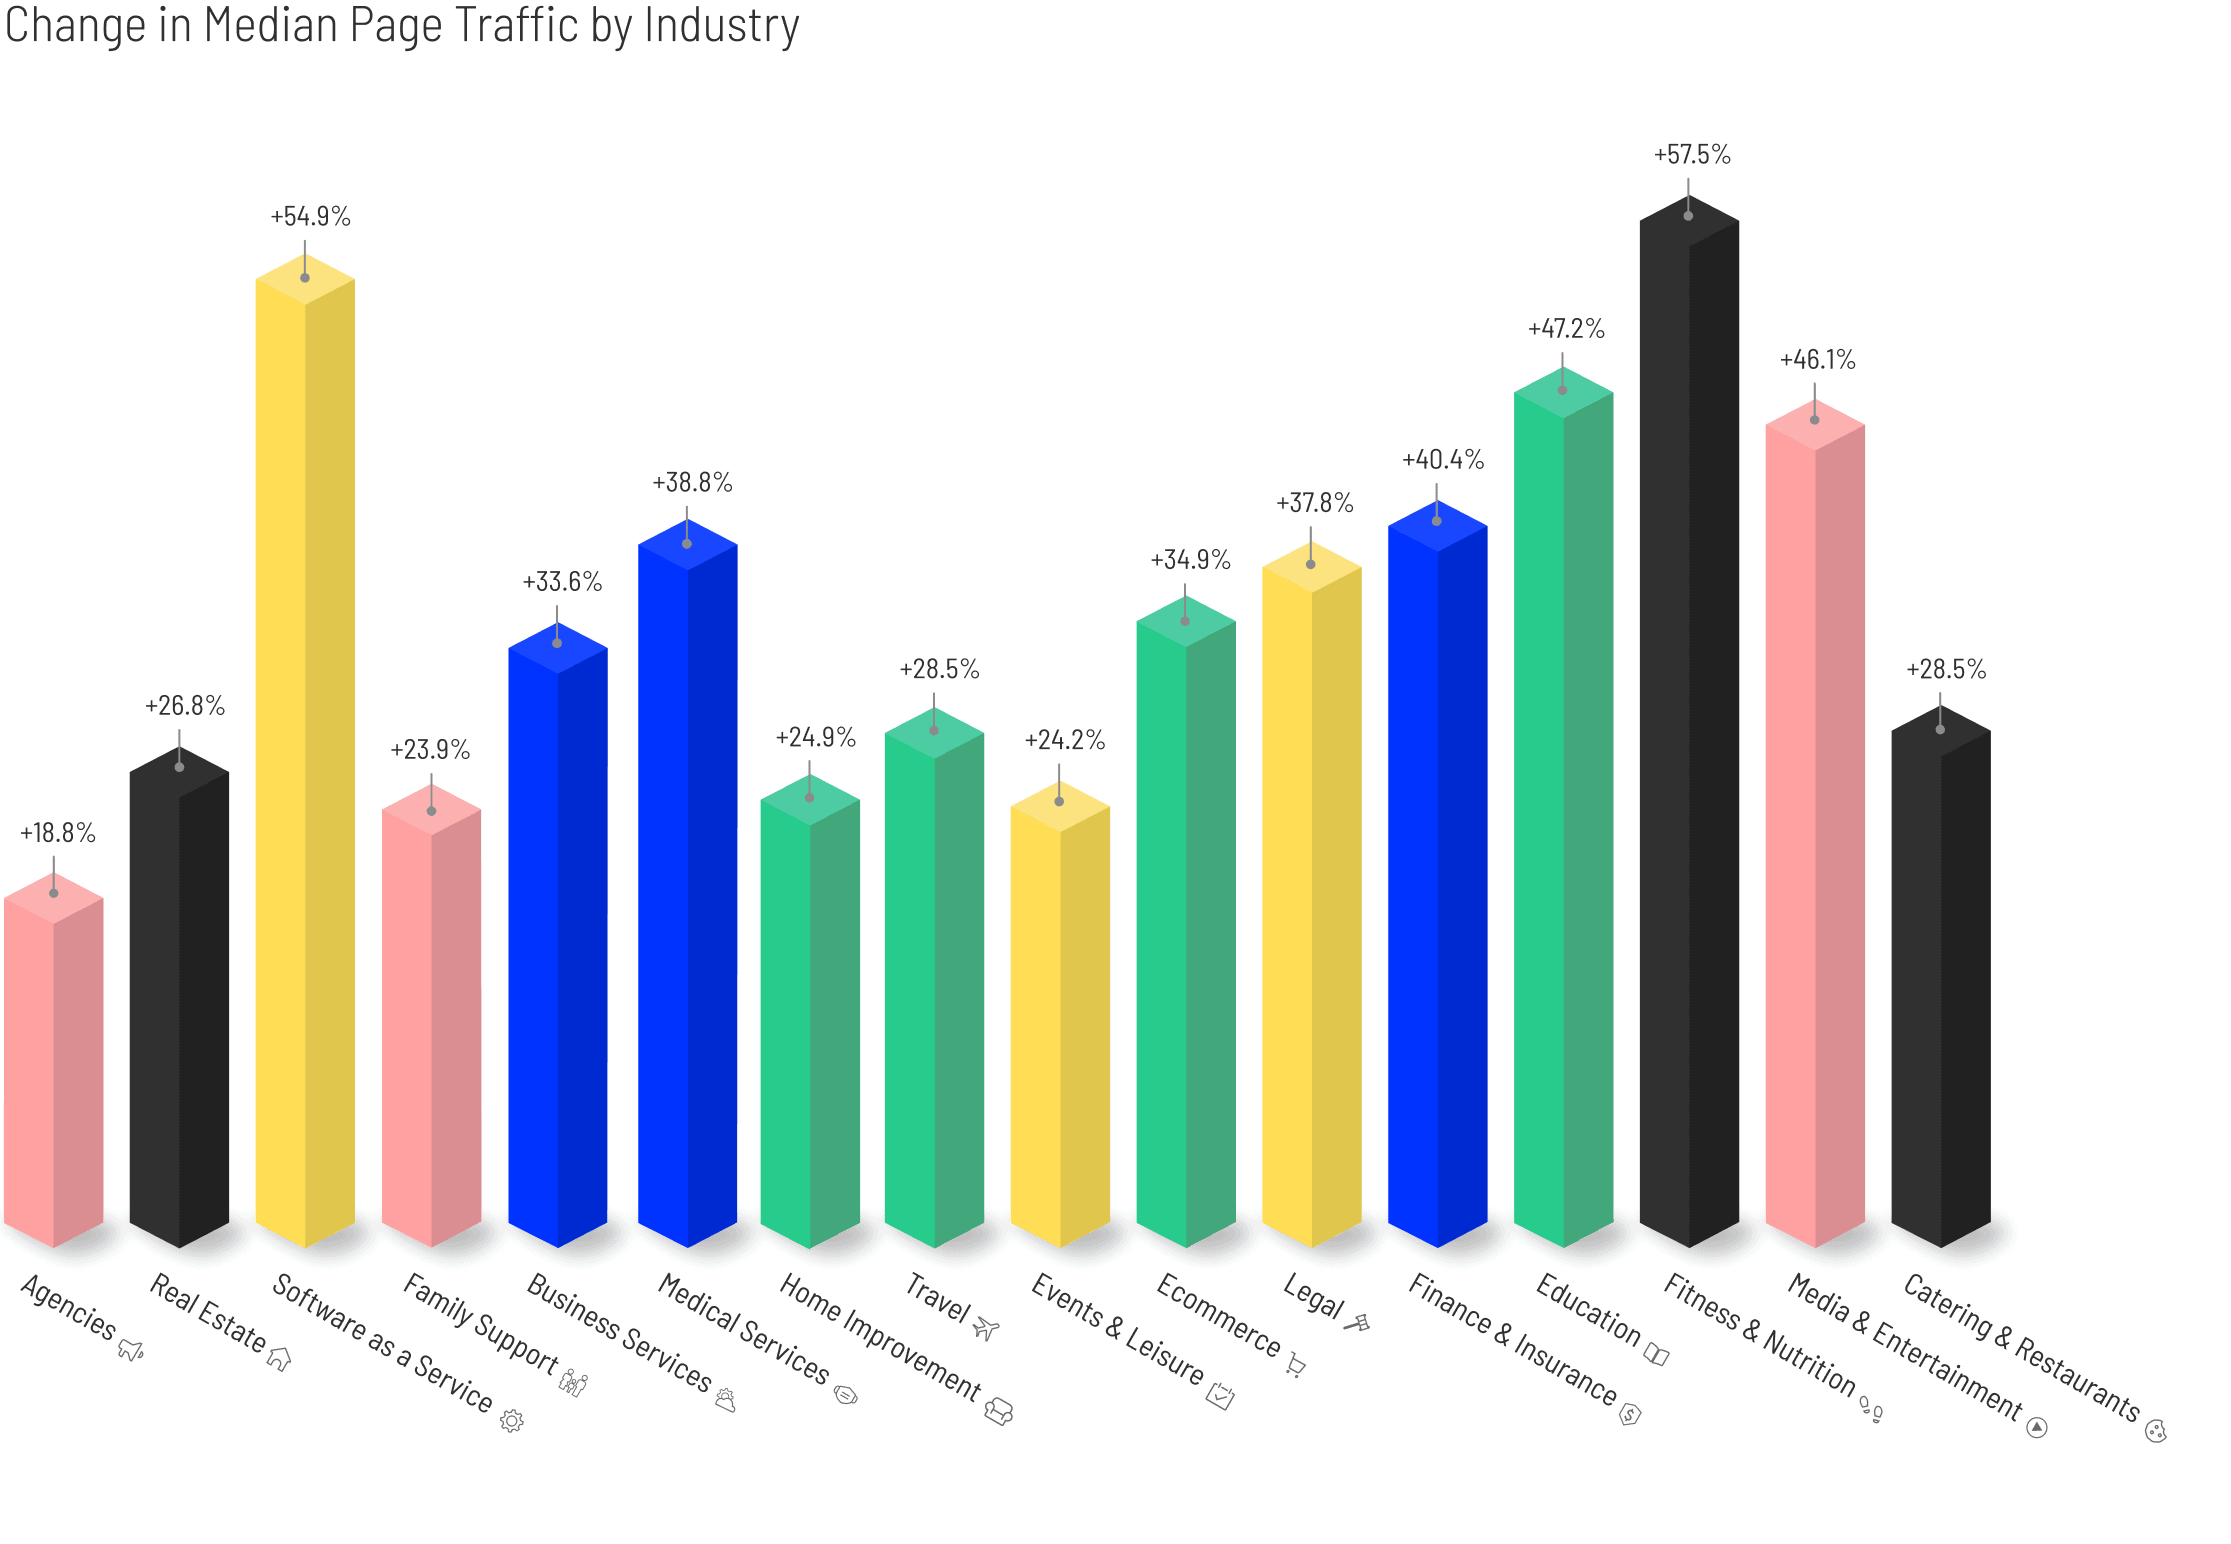
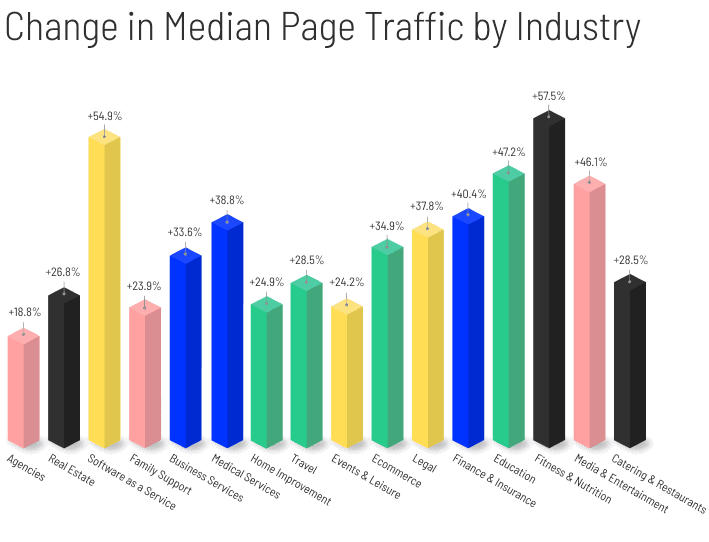
What’s this tell us? Even industries that cut back on digital marketing (with less active pages) actually had higher median engagement from visitors online. So, yes, fitness and nutrition got a nice bump in traffic (+57.5%) at the page level—but so did travel (+28.5%), events (+24.2%), and other spaces that you’d think would be getting fewer visits.
Of course, not every marketer will have seen that bump on their own landing pages. And that brings us to something particularly interesting: Nobody experienced COVID-19 the same.
Many businesses throughout the pandemic have either been easing financial commitments or further scrutinizing new ones—regardless of whether those businesses are experiencing growth or not. That applies to marketing, too.

Ecommerce Growth Consultant
Key Insight: Page Traffic Distribution
Marketers—even within the same industry—didn’t feel the pandemic equally.
Median page traffic is helpful for spotting visitor trends, but it’s kinda one-dimensional. It doesn’t explain how traffic is distributed between pages—and so it doesn’t do a great job reflecting the reality of most marketers.
When we looked at traffic distribution, we saw that—in addition to higher median page traffic—every industry saw more variance in landing page traffic last year. (Restaurants and fitness especially.) Or, in simpler terms: the gap between the most-visited pages and the least-visited pages in each segment grew.
Below, we’ve used a box plot to visualize the spread of page-level traffic for the restaurant and fitness industries, comparing 2019 and 2020. This’ll give you an idea of what we’re talking about.
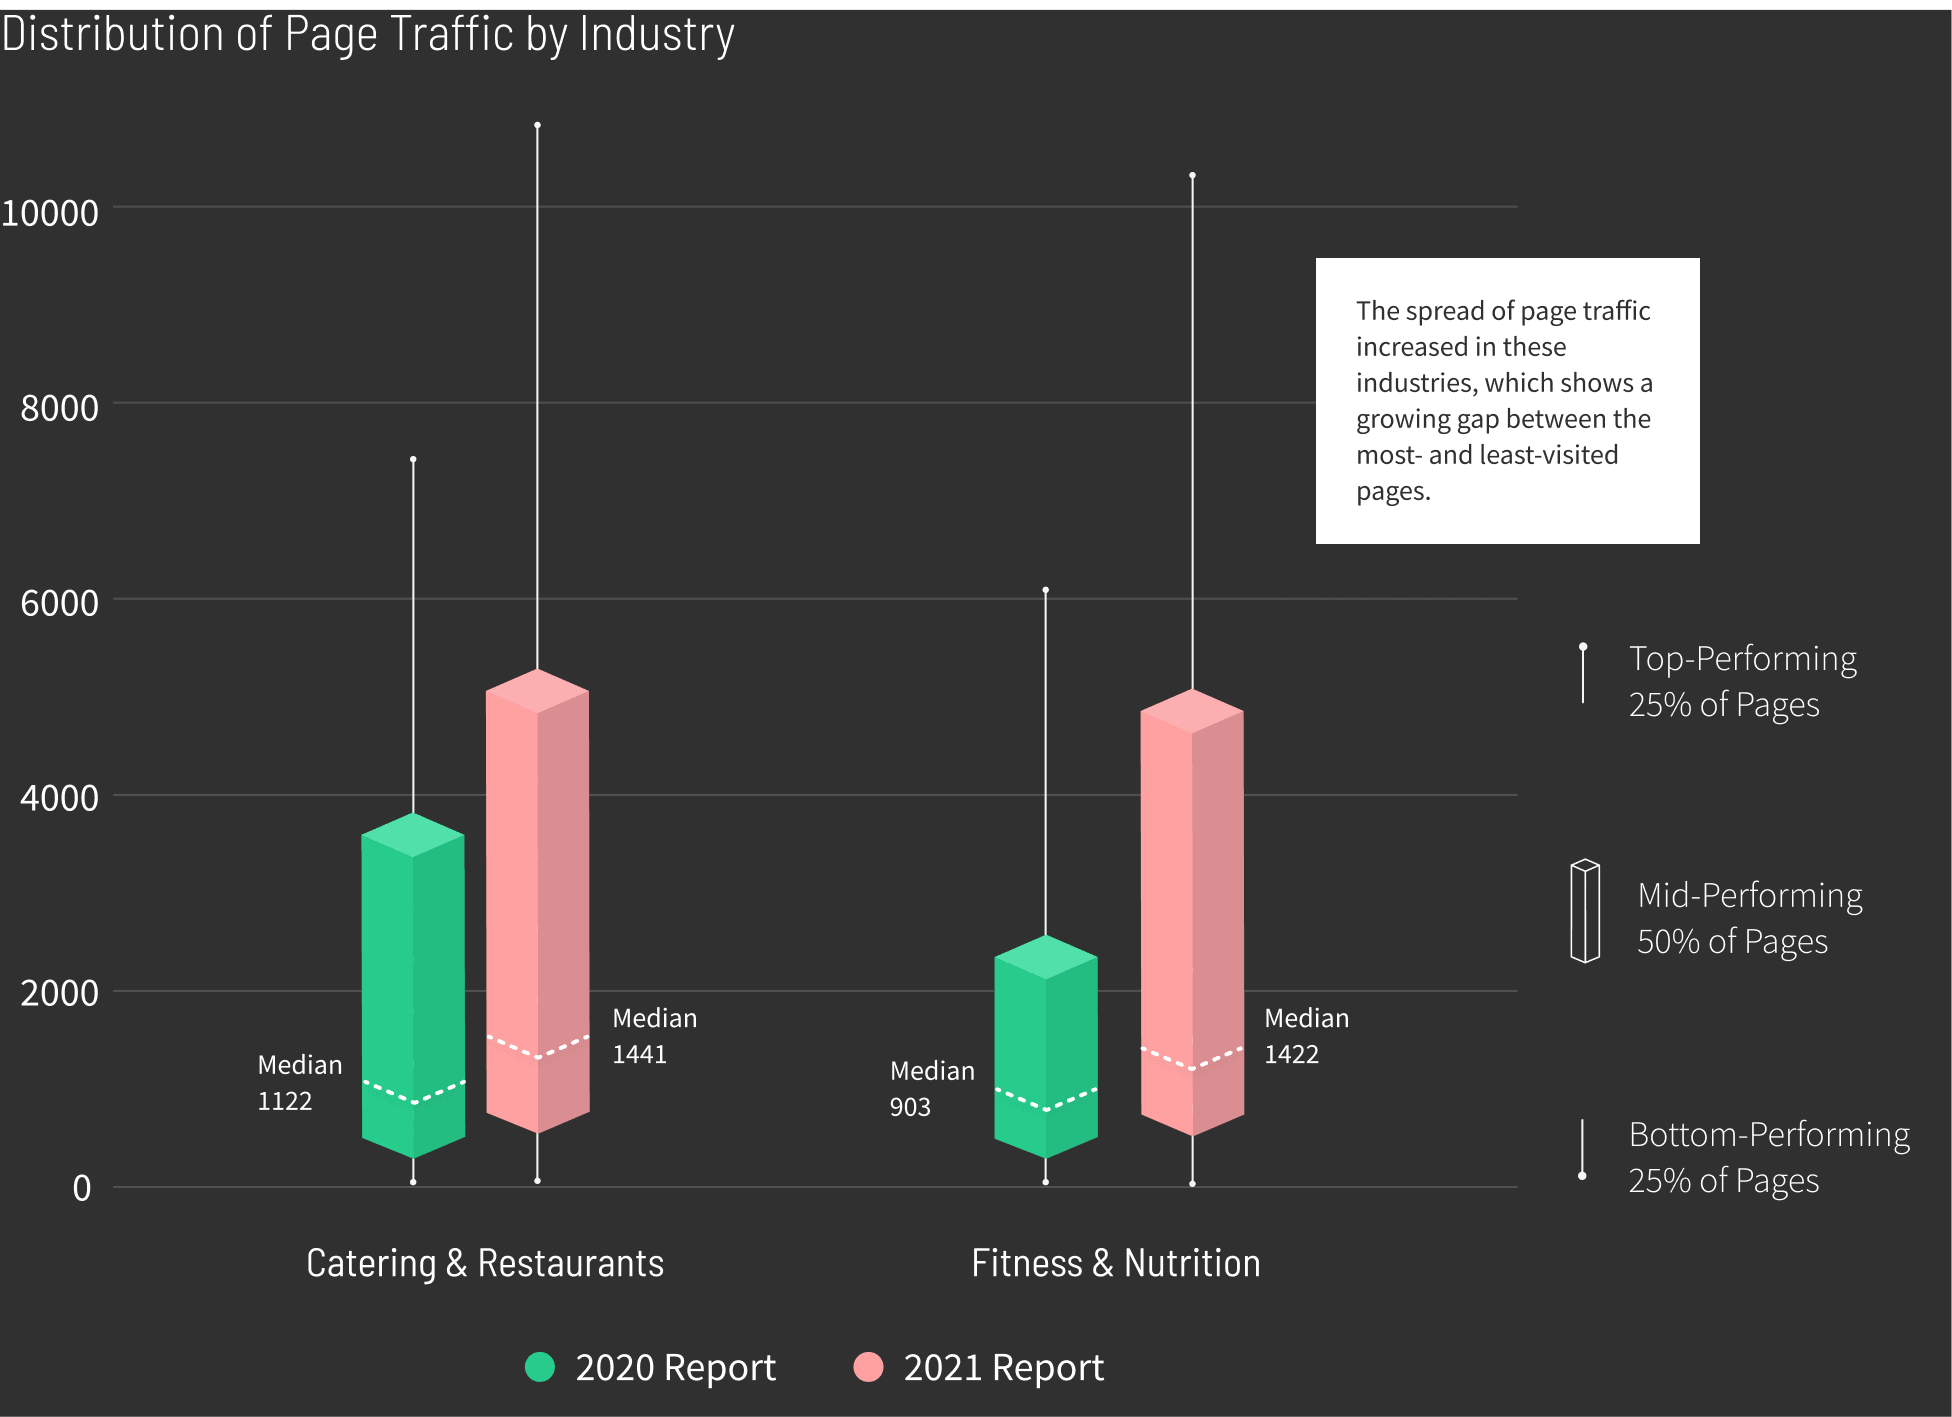
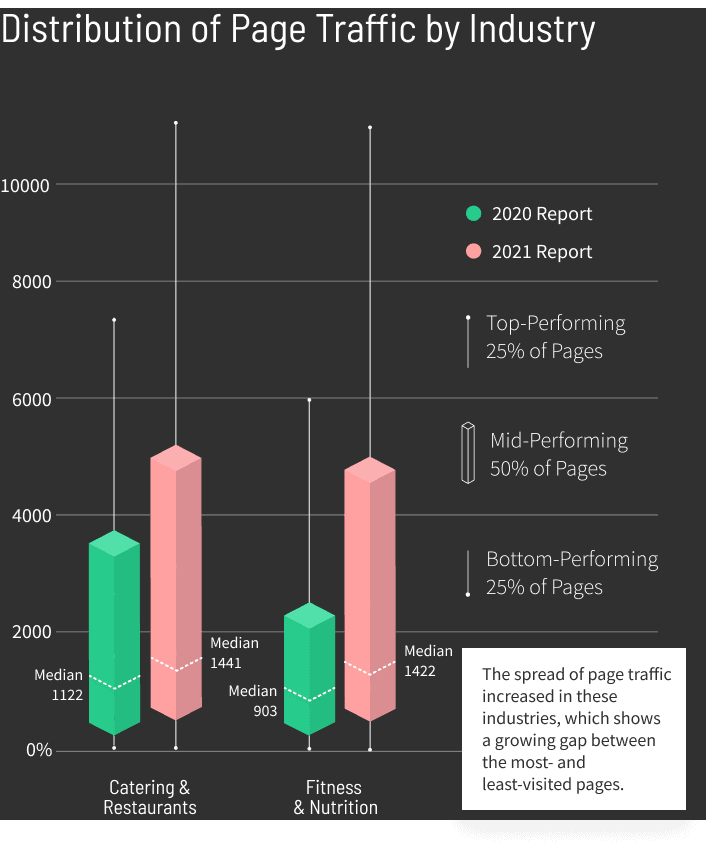
What’s this mean? This graph (called a “box plot”) shows how page traffic rates are distributed—the ‘box’ representing where most pages sit. (Note the median isn’t in the middle, as pages are rarely distributed evenly.) The vertical lines (or “whiskers”) represent the range of the remaining pages, excluding extreme outliers.
As you can see, some pages got significantly more traffic in 2020, while others got way less. But why?
The past year hasn’t been fair. Lots of us have been isolated from family and friends. We’ve lost out on promotions, and vacations, and concerts. Some have lost a lot more than that. And while nobody has been unaffected, there are people that have been more affected than others.
It’s been the same for digital marketing. Call it adaptability (or maybe just dumb luck), but when it comes to conversions, plenty of businesses will tell you they hardly noticed the pandemic. Some will report they had record years. Meanwhile, competitors that were less prepared to pivot are feeling the pain—maybe temporarily, maybe permanently.
COVID-19 Pandemic
Here are a few additional COVID-19 traffic insights.
Conversion rates are steady (even if traffic isn’t).
Despite less traffic or active pages in many segments we’d expect to be harmed by COVID-19 (like real estate, travel, events and leisure, and fitness), there haven’t been decreases in their conversion rates. (Actually, they’re mostly up.)

Phones are up, forms are down.
Between 2019 and 2020, the number of Unbounce landing pages pushing phone conversions is up about a third (+27.8%), while form-fill pages are down slightly (-5.8%). Our sample size for phone is pretty small, but it’s worth keeping an eye on.
Desktop traffic is up, but not for everyone.
SaaS, business services, media, travel, medical practitioners, and home improvement all saw increases in desktop traffic over mobile. This might be related to more people working from home—but we don’t see it in every industry.
Moving Forward
Marketers—let’s try to move past the pandemic.
At the time of writing this report, we’re still in the midst of a global health crisis. But vaccines are being administered. Lockdowns are being lifted. Sooner or later, we’re gonna start getting back to normal—whatever that is.
Whether you’ve struggled through the pandemic or unexpectedly benefited, this thing’s coming to an end. And while it’s not clear what the post-COVID world is gonna look like, we’re hopeful that there are better days ahead for all of us.

COVID-19 Pandemic
Build and launch your landing pages quickly (without the headaches)
No more being at the mercy of your designers’ and developers’ calendars to launch a single landing page for your next marketing campaign. With Unbounce you can run the show from start to finish with a drag-and-drop builder, 100s of templates, built-in mobile responsiveness, AI copywriting, unlimited test variants, and more.
Launch better pages, faster with Unbounce