What is pre-abandonment?
You’re probably already familiar with landing page abandonment, when a user drops out of a conversion funnel before reaching the end. Unfortunately, there’s another kind of abandonment that many online marketers aren’t even aware of: pre-abandonment.
Landing page pre-abandonment happens when users, who have clicked on a link (for example an email link or a PPC ad), hit their back buttons before the destination page has loaded. The most common reasons for pre-abandonment are slow page speed (the user simply loses patience waiting for the page to load) and page availability issues (in other words, the page is serving a 400 or 500 error).
We’ll explain why landing page pre-abandonment is so expensive, how to determine if it’s affecting you, and what you can do to run a better overall campaign.

Why does landing page pre-abandonment matter?
The first problem is that pre-abandonment can cost you cold, hard cash: you’re paying for users who never even see your pages. Worse still, there’s a pretty good chance that the money you spend on clicks (paid keyword searching, display advertising, affiliate links, etc.) from users who pre-abandon has no value at all (even any brand awareness gains will be eroded by a negative user experience).
The second problem is that it skews all of your metrics, making it look like your site is performing better than it really is. Here’s why: pre-abandonment has a nasty little habit of happening before your web analytics have fired. That makes it difficult to spot, and means that your site traffic gets under-reported (more people came to your site than your metrics show because they left before they got counted). So now many of the KPIs you use to measure your marketing effectiveness and business performance, like abandonment rate and conversion rate, look better than they really are.
How do I know if landing page pre-abandonment is affecting me?
To get a measure of the problem, you need to compare data from different systems: on the one hand, the clicks you’ve purchased, and on the other, the pageviews logged in your analytics tool. The difference between these is the important thing: the wider the gap between the clicks you’ve paid for and the visits to the landing page you’ve actually received, the worse your pre-abandonment is.
Here’s a walk-through of how to calculate pre-abandonment in Google Analytics. In this example, we calculate the pre-abandonment rate on a Google Adwords campaign. (An important note: to get accurate numbers you need to make sure that your Google Adwords and Google Analytics accounts are connected correctly.)
- Create a custom report in Google Analytics.
- Add the Date and Ad Destination URL as Dimensions. This allows you to chunk your data over time by landing page for easier analysis.

- Add the following metrics:
- Pageviews (if a user views the same page twice, Google will count two pageviews, which can make it look like you have fewer clicks than views, so this metric gives you the lower bound for pre-abandonment).
- Unique Pageviews (Google only counts one page view per user with this metric, and so if a user clicks an ad twice Google will measure two clicks, but just one unique pageview. Therefore, this gives you the upper bound of the problem).
- Clicks counts your Google Adword clicks.
- Cost and CPC help to establish how much pre-abandonment is costing you.
- Create a filter for mobile traffic. In this report, we’ve segmented again by creating two different reports for mobile and desktop.
- Finally, ensure that the view data is attributed to a paid campaign by filtering by the Medium.
- View the report, and export it as an Excel file.
- Open the file in Excel and add 4 new columns
- Pre-abandonment (low) – Calculate this percentage using the formula (clicks – pageviews)/clicks. To account for days with zero clicks and days where views exceeded clicks, the exact formula we use is =MAX(IF(Clicks=0,0,(Clicks-Pageviews)/Clicks),0).
- Pre-abandonment (high) – Calculate this percentage using the formula (clicks – unique pageviews)/clicks. Follow the same arguments as given in the formula above.
- Pre-abandonment cost (low) – Calculate this value by multiplying the pre-abandonment (low) percentage by the amount spent on the Adwords campaign.
- Pre-abandonment cost (high) – Calculate this value by multiplying the pre-abandonment (high) percentage by the amount spent on the Adwords campaign.
- You can now calculate your daily and total financial loss to pre-abandonment, by segment to get a granular view on which pages are hurting worst on which devices.


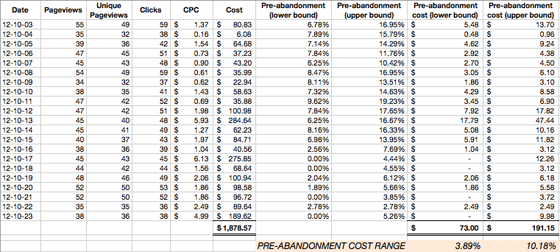
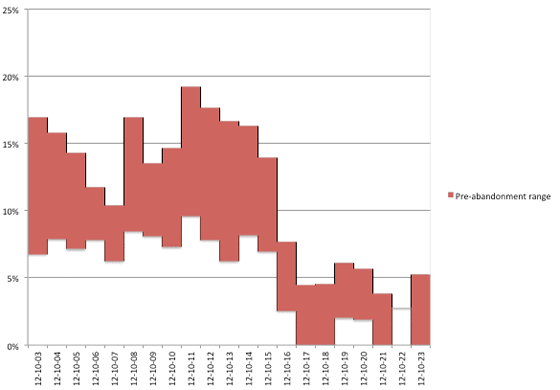
You can see that in the example above, between 3.89% and 10.18% of the campaign spend was blown on visits that could never have converted. By plotting the pre-abandonment range on a chart, we see that partway through the campaign, the site owner caught the problem and managed to reduce it by removing a third-party service from the page.
Unfortunately, it’s difficult to get an absolute number: the metrics have nuances which mean you’ll likely be working with a range. The important thing is that if your upper bound is over 10% for any of your landing pages, it’s worth investigating more closely to see if you can bring that number down.
How do I find the cause of my pre-abandonment problem?
The two most likely culprits for pre-abandonment are slow page speed and page availability issues. In order to find these numbers, you need to monitor your pages’ availability and page speed using a synthetic measurement tool (one which simulates users loading your pages).
So which pages should you monitor, and what should you look for? Here are a few tips:
- Focus on your landing pages, where your users are least engaged. The lower the engagement, the less tolerant users are.
- Focus on key pages closer to the top of your funnel, e.g. product or product category pages.
- Any landing page that takes longer than 4 seconds to fully load is a candidate for improvement. Pages inside the conversion funnel, especially those close to checkout can have higher thresholds. A user may not bother waiting for a page they’ve requested from an ad, but they’ll spend more time waiting for the page they’ve put their credit card information into.
- Pay close attention to how the page behaves over time. Averages can hide bad spikes. If you see your page speed or availability errors spiking, you know you have a problem. Reading the relative standard deviation of page speed can be helpful too: close to zero is great, and anything over 50% should be monitored.
How can I prevent pre-abandonment and mitigate its effects?
Okay, so you’ve done your preliminary analysis, and you’ve found that pre-abandonment is undermining your return on marketing investment. What should you do about it?
- Start by getting a really solid baseline of your current situation. Use the method given above to track pre-abandonment on your key landing pages over time (you need to select a period of time that is stable, i.e., not subject to seasonal variation or big development changes). Page speed varies greatly by region and device, so segment your baseline by campaign, geographical region and user device. Identify which of your pages are best and which are worst.
- Take immediate action if you’re losing a significant portion of your paid traffic to pre-abandonment:
- Spend more money on your best pages and less on your worst (even if only a temporary measure while you address the underlying cause)
- Disable mobile advertising if your bleed is worse on mobile (perhaps your pages aren’t mobile optimized or are not well optimized)
- Try to focus on the geographies where you’re getting the best results
- Now try to figure out the underlying cause of the issue; hypothesize the cause(s) of the problems on the worst pages:
- Perhaps you’re using a deep-linked database-backed page as a landing page, and it’s not really fast enough to be one
- Perhaps your images are too heavy, or not optimized
- One or more third party services may be slowing your pages down or blocking the page load
- Experiment with eliminating the possible cause of the problem:
- Remove pixels/services from vendors who are slowing down your pages
- De-risk your pages by reducing your reliance on third parties (such as social networks that aren’t relevant to your audience)
- If your Development team can’t get to it quick enough, use a landing page tool (such as Unbounce) to create landing pages, and either switch back when you have fixed your pages or carry on (and get A/B testing and conversion metrics as an added bonus!)
- Continue to monitor the situation. Your website performance will always fluctuate. The closer an eye you have on the pages that are important to you, the more chance you have of mitigating the adverse effects of slow-downs in order to get the most out of your campaign and your budget.
Understanding landing page pre-abandonment, and keeping it on your radar, will allow you to direct more of your media to pages that are good, less to those that are bad, and will help you to deliver better results out of your marketing campaigns.
![]()
