
You might’ve noticed that 2020 was an interesting year for marketing. (Yeah, that’s the word for it. Interesting.)
For some marketers, the effects of a global health crisis felt (and continue to feel) insurmountable.
For others, the pandemic encouraged creative thinking to take advantage of new opportunities. There are even a lucky few marketers who hardly noticed it—at least in terms of their conversions. And an even luckier few benefited directly. (That elusive product-market fit just kinda works itself out when you’re peddling business casual pajamas.)
The truth, though, is that the gulf between top-performing digital marketing campaigns and the rest of the pack has never been wider. Wherever you land on this spectrum, the pandemic shake-up means that the competition you face is fiercer than ever before. The most successful businesses in your industry aren’t sitting on their hands in 2021—they’re looking for ways to give themselves an advantage in the post-COVID world and edge out their competitors.
And that’s why it’s never been more important to ask yourself this question:
“What’s a good, bad, or average conversion rate for my landing pages?”
How do your pages stack up against the competition? How do you stay the leader, or close the gap between yourselves and the best performers? And how has the digital marketing landscape changed between the simpler days of 2019 and today?
That’s where industry benchmarks come in—and that’s why we’re thrilled to bring you a fresh (and free) Conversion Benchmark Report for 2021. It helps answer all these questions and more.

Introducing the 2021 Conversion Benchmark Report
This year’s Conversion Benchmark Report uses machine learning to analyze more than 33 million conversions across 44 thousand Unbounce-built landing pages. In terms of sample size, we analyzed more visits to these landing pages than the populations of Canada, Hong Kong, France, Mexico, Laos, and Ireland combined.
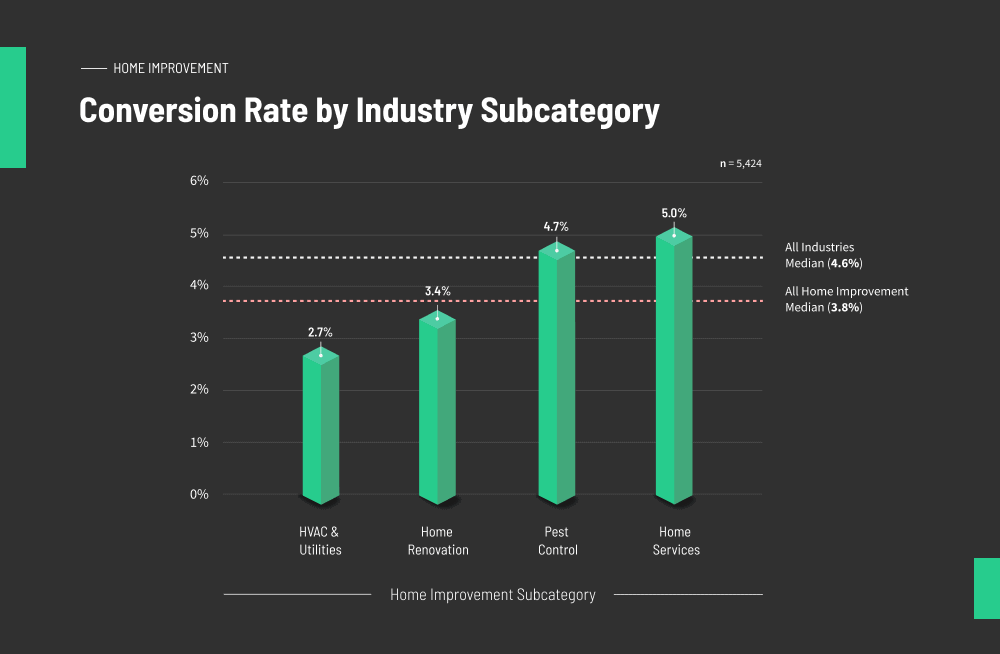
You’ll find median conversion rates broken down to 16 key industries.
In many cases, we’ve got wide enough sample sizes to sort them into subcategories too, so you can see how your brother’s pest control service measures up against your sister’s HVAC company. (Or how your uncle’s cybersecurity software converts against your great aunt’s cloud accounting platform. Quite a family you have.)
Why do we report on median instead of average (mean)? Our goal is to provide you with a realistic picture of where you stand, so this year’s report lists median conversion rates as our measure of central tendency instead of the mean. We found this reduces the impact of outliers (like pages that convert five times better than the rest) on the final benchmarks.
Benchmarks can energize your post-pandemic rebound strategy in four big ways:
- They’re a form of competitive intelligence. They help you identify gaps between your performance and what the rest of your industry considers to be a good conversion rate.
- Paired with AI, they let us deliver actionable insights you can apply today. The data doesn’t just show how you’re performing, it can be the starting point of finding out why—and then making smart changes.
- They reveal data-supported best practices, and you’ll waste less time and traffic testing unproven optimizations that our machine learning analysis shows don’t necessarily work.
- They help you build a culture of continuous improvement in your organization. It’s harder for your team to be happy with “just okay” if they’re seeing something to strive for.
Let’s rundown some of the deeper insights, how we got ‘em, and how you can apply them. (If you’ve got an itchy mouse-finger, you can jump right into the Conversion Benchmark Report now. It’ll open in a new tab.)
Conversion Optimization Insights: Beyond the Benchmarks
Benchmarks are tremendously helpful, for all the reasons we just talked about. (If you work for an agency, you already know this. They’re a baller way of showing the value of what you do—and helping clients determine their true conversion potential.)
Beyond industry averages, though, the Conversion Benchmark Report contains dozens of data-backed insights that you can use to build variants and boost your conversion rates. Using A/B testing or—much easier, if you’re short on time or traffic—Unbounce’s Smart Traffic, you can have variants running today based upon learnings in the report.
Start by exploring the report, build some variants, automatically optimize ‘em using AI-powered tools like Smart Traffic, learn new things about what’s working, then rinse and repeat. You’ll save time, boost conversions, and increase revenue and ROI.
Traffic Insights: What Channels Deliver the Highest-Converting Visitors in My Industry?
You asked for it! New for the 2021 report, we’ve layered in some data-backed insights about what traffic channels are most popular (and perform best) in many industries. Is paid search really all it’s cracked up to be? Or are email and social unsung heroes you should be exploiting more often? And should you spend your time optimizing for mobile or desktop? (The answer… will surprise you.)
Of course, in many of the industries we analyzed, paid search ads are by far the dominant way of driving new traffic. That may not be surprising—PPC has always been the primary use case for landing pages—but take a look at the graph from business services below:
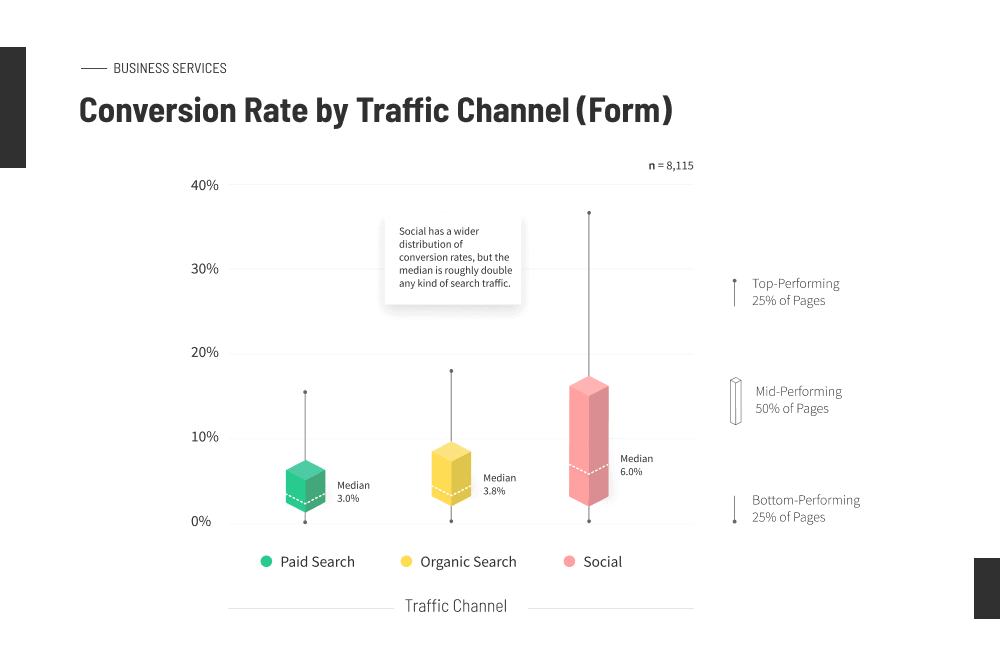
Not only is the median conversion rate for visitors that come from social media (6.0%) twice that of paid traffic (3.0%), but top performers achieve conversion rates well into the double digits. Our best guess why? These business services pages are built specifically to target and convert social visitors, matching channel and landing page to deliver maximum relevance.
This is just one industry, but the Conversion Benchmark Report covers many others to give you the best sense of what channels deserve your time (and money) and which ones you can safely ignore. Jump into the report if you’d like some suggestions on how to apply these learnings.
Reading Ease Insights: How Do I Best Communicate with My Target Audience?
In copywriting circles, the received wisdom is that clarity comes above all else. If you’re looking to put up the fewest hurdles possible between audience and offer, it usually makes sense to keep things basic.
Our data, however, complicates this equation. Is simple always better? Nope. It turns out that different industries tend to convert more often at different reading levels (and some see weaker relationships between conversion rates and readability than others).
In other words, ensuring the readability of your pages is key for some marketers, and relatively unimportant for others. Cybersecurity companies, for instance, don’t appear to benefit from simpler language, while landing pages promoting mobile apps do.
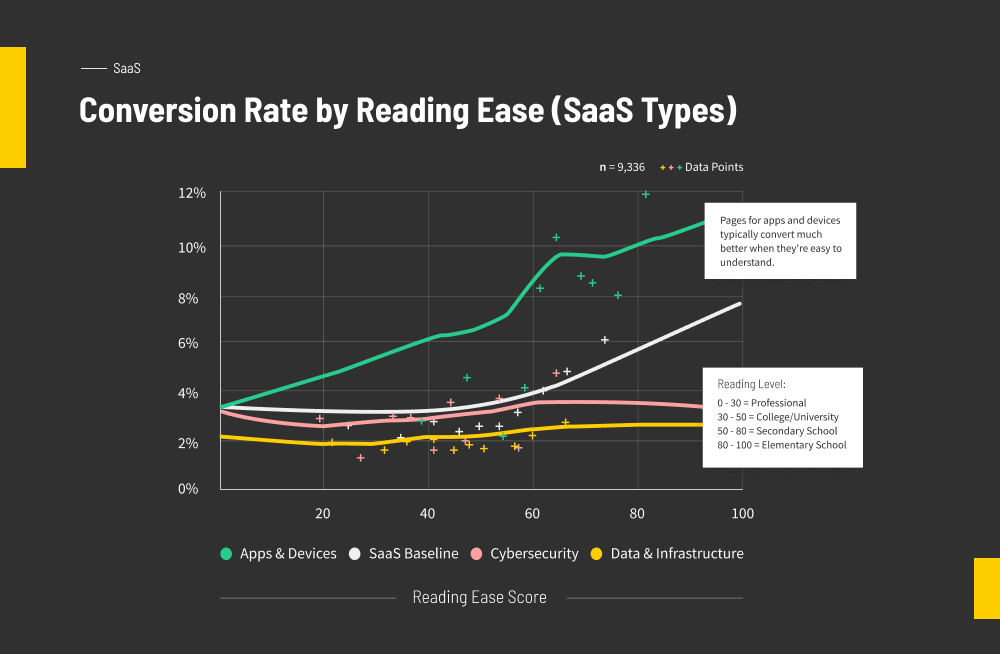
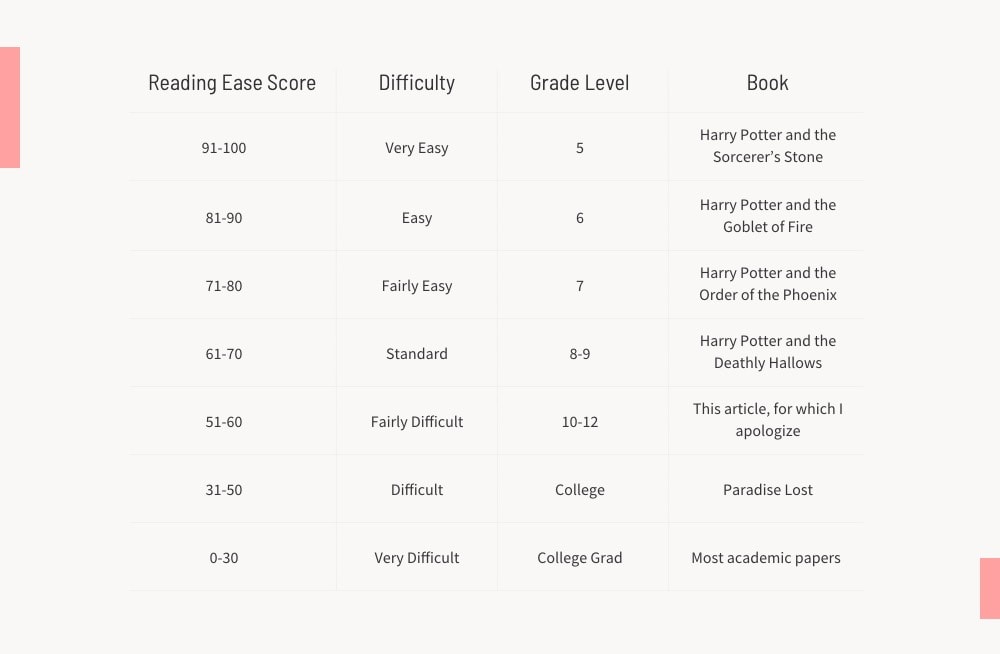
How’d we get these numbers? Our machine learning analysis enabled us to look at copy from 34 thousand pages. Each page is assigned a Flesch reading ease score based on the average number of syllables per word and words per sentence. More syllables and more words mean more… harder.
Here’s roughly how the scoring breaks down:
Word Count Insights: What’s the Best Length for My Landing Pages?
While the data confirms the best practice that shorter pages tend to convert better, many industries have sweet spots in which they can break the rule—if you’re going to create a long-form landing page, you should go this long.
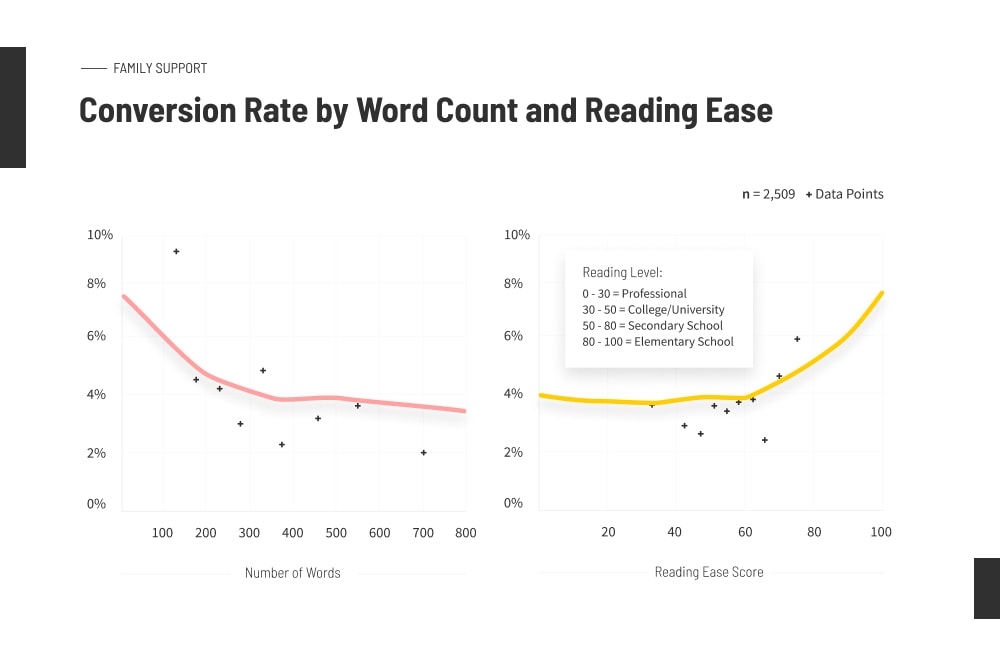
At what length do landing pages for family services convert best? The graph provides answers.
Depending on your offer and industry, you may find that you need to use more words to get your point across, but graphs like the one above can let you know what’s ideal. For family services, that’s 300-500 words (if you can’t get it shorter than 150 words). For other industries, it can be more or less. Whatever the case, creating variants based on our findings can definitely be a good candidate for A/B testing or Smart Traffic.
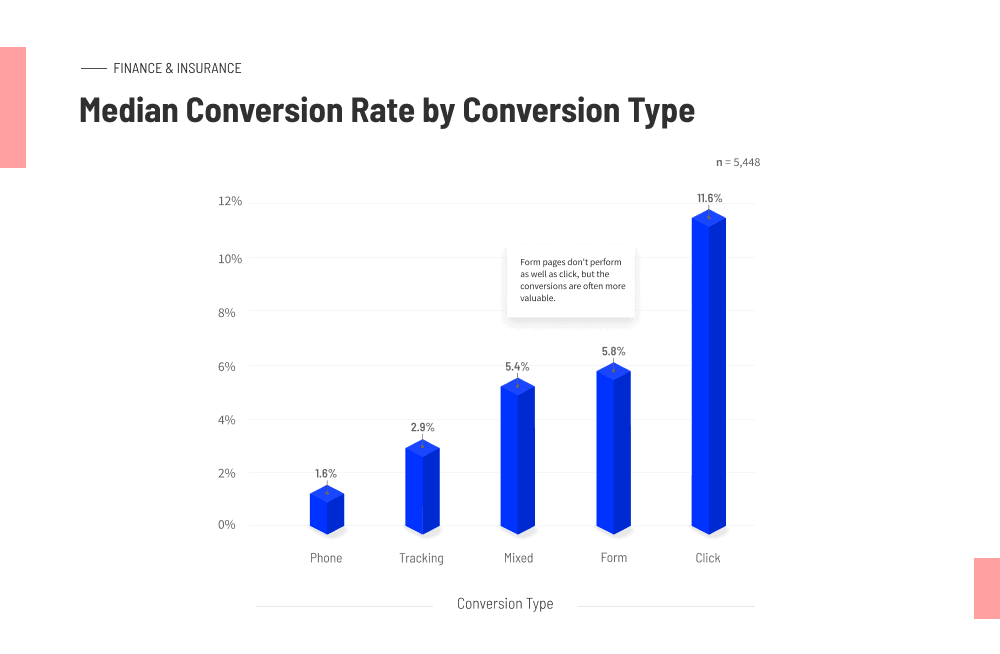
Conversion Type Insights: How Do I Choose Which Types of Landing Pages Convert Best?
It may seem obvious that a click-through page is gonna outperform one that asks your visitors to fill out a form. Clicking a button feels a heck of a lot less like commitment than sharing swathes of personal info, after all. (People have been pointing this out since, uh, forever.)
But there’s actually a lot of nuance when it comes to conversion types that can be effectively applied to your campaigns to improve campaign performance. For instance, did you know that in the finance and insurance industry, forms convert best when you use two fields?
Or that mixing multiple conversion types—as in, “I’ll just throw in this phone number to be safe”—tends to produce weaker results?
What if your industry doesn’t appear in the report? With machine learning helping us to sort thousands of landing pages in a logical way, we’ve increased the number of industries covered from 10 to 16, and adding subcategories (verticals) whenever sample sizes allow.
If you don’t see yourself represented, compare your conversion rates to industries with similar audiences and conversion goals. While we don’t actually recommend comparisons between very unrelated industries (except for fun), let your judgment be your guide.
Sentiment Insights: What Emotions Might Relate to Better Conversion Rates?
You likely know in your gut that people’s feelings can impact their decision to buy, but which ones actually drive conversions on your landing pages? To find out, we ran an ML-powered sentiment analysis that looked at emotion-associated words that might relate to healthy conversion rates—and which might even be slowing you down.
(Spoiler: Using trust words isn’t always advisable. “Trust us.”)
If you’re running an ecommerce business (especially in the midst of a pandemic), you might be tempted to press down hard on those pain points your visitors may be feeling. Why not hammer home all their worries before promising relief? Isn’t that B2C Marketing 101?
Turns out, not so much. Look at the graph below.
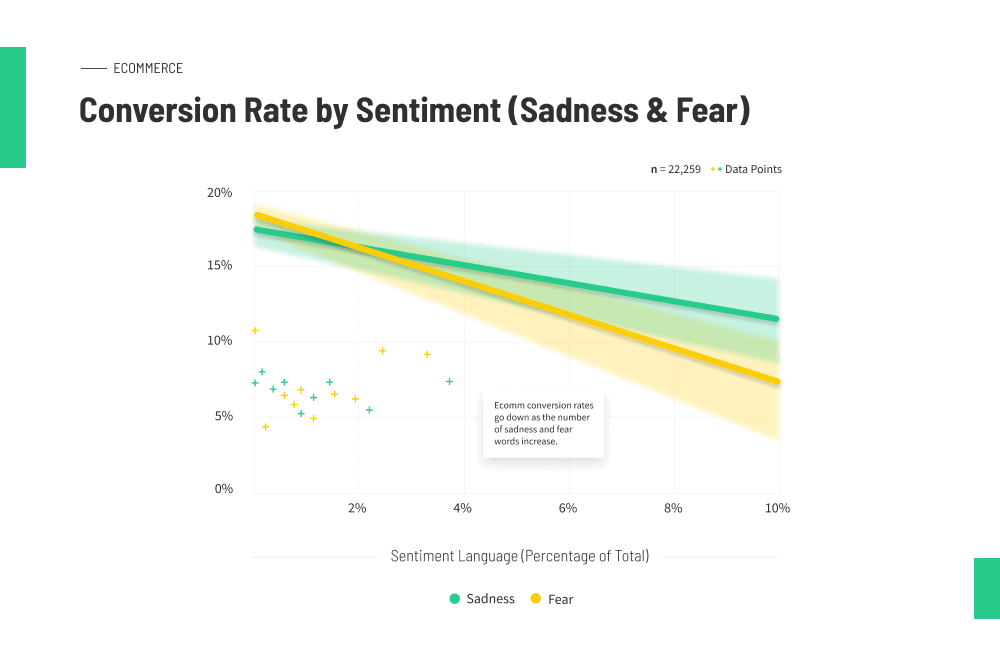
When it comes to ecommerce conversions, it turns out that language that conveys negative emotions (like words associated with sadness and fear) can correlate with lowered conversion rates. Our advice: Stay positive, stick to benefits, and keep ‘em clicking that “Add to Cart” button.
You can explore this example, and many others, in the report.

A Conversion Optimized Approach to Your Next Campaign
When it comes down to brass tacks, all this benchmarking is valuable only so you can use it to build a better conversion machine from what you learn. How do you do it?
- Learn. Explore the insights from the 16 industries in the report. How are your landing pages stacking up against the baseline? Are you way out ahead? Are you falling behind? Start with your industry, sure, but take a look at others too. There may be insights that are worth exploring outside your own arena.
- Build. Apply the data learnings to your own campaigns. Create a variant (or more than one variant) of your page that applies some of the insights we’ve provided. For example, you might dial down the jargon until you hit the optimal Flesch reading score. (You can use the free readability formula tool here to test it for yourself.)
- Optimize. Keep in mind that our data analysis reveals trends and tendencies rather than absolutes. You’re making informed decisions when you apply these learnings, but testing is still your best way to confirm. If you’re using the Unbounce Builder, just publish your variants and turn on Smart Traffic. It’ll use machine learning to automatically decide which variant is right for which visitors.
- Learn (Again). Keep it up! The report is based on aggregate data, but your optimization efforts yield fresh learnings that are now specific to your campaign. Use them to deploy variants relevant to your offers and customers and further increase the conversion lift you’ve already achieved with Smart Traffic.
In short, this year’s report uses AI to identify opportunities you simply couldn’t spot without the processing power of a machine. But you’re the special ingredient here: by pairing your knowhow and intuition with AI-based technologies, your marketing grows smarter.

Whether you sell “bizcaz” PJs, software that lets people appear awake on Zoom when they’re actually sleeping, or something altogether more practical—are you confident enough to swagger into your next meeting, snap your suspenders, fire those finger-guns in your boss’s direction, and let everyone know about your team’s big win?
Take a gander at the 2021 Conversion Benchmark Report, and let us know what you think in the comments below.

