
Conversion rate optimization is often associated with increasing sales and revenue. But the principles of CRO can be used to improve any desired action.
In this post, I want to focus on applying CRO principles to social media campaigns. How can we use tactics like A/B testing and heat maps to increase our tweet click through rates, our social authority and the likelihood of our readers sharing our content?
Here are A/B testing ideas that you can use to improve your reach and engagement across social media.
1. Test optimal sharing times/days with SocialBro
If what you’re sharing is already engaging, then the fastest ways to multiply social media engagement is to improve when you’re sharing content.
According to SocialBro, I have 6.5x as many Twitter followers online at 5pm on Tuesdays as I do on Saturdays at 11am. In other words, changing when I tweet could have as much as a 650% improvement on the visibility of my tweets.
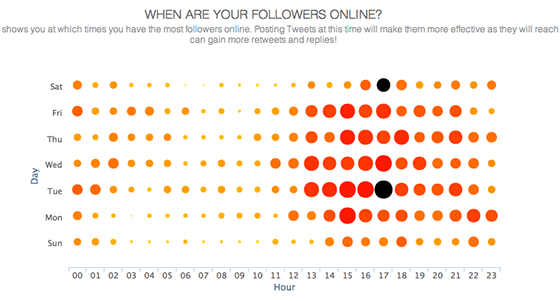
HubSpot’s social media scientist, Dan Zarrella, has done a lot of work on measuring effectiveness on Twitter. He found that, on average, the best time to tweet is at 5pm on Wednesdays and weekends if you want retweets and noon or 6pm for high CTRs.
Using Buffer, you can easily setup scheduling so that any tweets in your “buffer” are sent out at the times of day when the largest proportion of your followers are online.
2. Test social button positions (or whether you should have them at all)
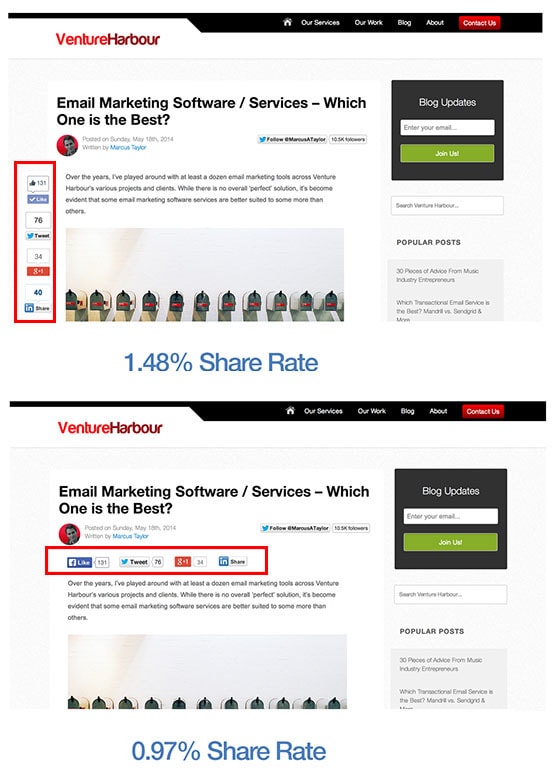
The position of your social media sharing buttons on your blog or landing page impacts the number of readers who share your content.
After carrying out numerous experiments to work out the best position for social sharing buttons on the various sites I work on, it’s become clear to me that there is no one-size-fits-all best position.
On my own blog, I’ve found that a floating sidebar outperforms having share buttons exclusively above or below a blog post. I recently ran this experiment on this blog post and found that using a floating sidebar with sharing buttons increased the rate of sharing by 52%.
Still, one school of thought suggests that having no sharing buttons is, paradoxically, optimal for increasing social engagement. The main reason is summed up nicely by this tweet from Smashing Magazine:
We removed FB buttons and traffic from Facebook increased. Reason: instead of "liking" articles, readers share it on their timeleine.
— Smashing Magazine (@smashingmag) May 22, 2012
Another valid argument suggests that seeing a post with a low number of shares reduces a reader’s likelihood to share it (a momentum effect). While this may be true, the opposite is equally true; seeing a post with a large number of shares adds credibility, increasing a reader’s likelihood to share it.
The lesson here is don’t take anyone’s word on the best placement or plugin to use for your social sharing buttons. Run the experiment to see what works for you.
Note: To run this experiment you’ll likely need to tag your social sharing buttons with event tracking parameters in Google Analytics. There are some useful posts and discussions on setting this up here, here and here.
3. Test headlines to increase social CTRs
You’ve probably heard by now that the secret to the success of Upworthy, BuzzFeed and Huffington Post is their focus on split testing their headlines.
Upworthy’s editor-at-large has said that before publishing an article, every writer at Upworthy has to come up with at least 25 different headline variations to test.
I recently discovered the power of this tactic in a really strange way. I wrote a blog post originally titled, “How Six Popular Blogs Grew to Millions of Visitors in Less Than 2 Years.” I had put my back into this post and was pleased to see it go live.
But two weeks later it had about 50 shares, which I was gutted about. After all, I had probably spent a good 15-20 hours researching and writing the post – only 2.5 shares per hour of writing!
Fortunately, I had just installed a plugin called WP Title Split Tester, which does exactly what it says on the tin. After a few days of gathering data, it quickly became clear that my headline just wasn’t very clickable. On average, it had a CTR of 1.94%.
So I came up with a handful of variations, including, “Deconstructing How Mashable, ProBlogger & KISSmetrics Reached Millions of Readers.”
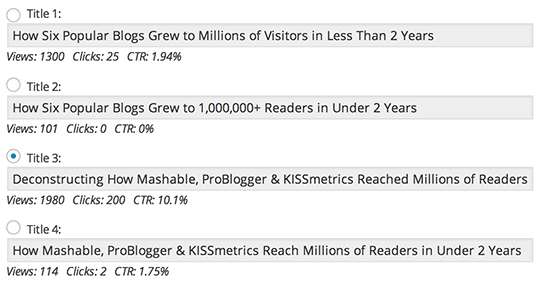
This new headline had a CTR of 10.1% (nearly a 500% improvement over the original). Within a matter of days of switching to this headline, the post went viral, generating close to 2,000 shares.
I’m not alone, either. Leo from Buffer published a great post last year showing how easy it was to double the performance of his blog posts by split testing two different headline variations on Twitter.
The lesson here is one that David Ogilvy stressed when he said:
“When you have written your headline, you have spent eighty cents out of your dollar.”
Great content with a poor headline will always generate poor results. If you’re using WordPress, install a title split testing plugin and make a habit out of testing multiple headlines for every post you create.
4. Test content chunks to maximize engagement
We’re naturally wired to judge a book by its cover. In a list post like this one, many people read the introduction or the first list point and then decide whether they’d like to read on.
If you’re interested in optimizing a particular piece of content for engagement, it can be worthwhile to run a multivariate experiment to identify the optimal ordering of content blocks.
If you want to get really geeky, use a heat map to identify where most readers are dropping off, then add something interesting around that point to keep them engaged.
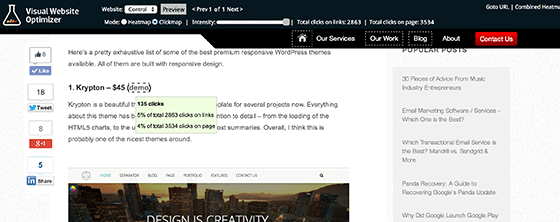
In February, I wrote an insanely long post showcasing 109 beautiful responsive WordPress themes. I figured no one would actually scroll through all 109 themes, but wanted to see whether changing the ordering of the themes would impact engagement and time spent on page.
Using a combination of old-fashioned spreadsheets and VWO click maps, I was able to identify the abnormally engaging and unengaging themes. This enabled me to reorder the themes so that the most engaging themes were positioned at the top of the post.
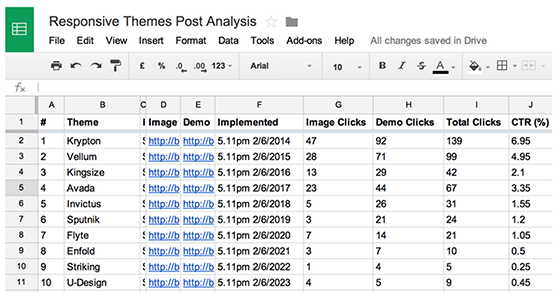
The heat maps and click maps also showed me where I was receiving the biggest drop-offs in engagement. By moving some of the themes with abnormally high CTRs to these points I was able to extend the average time spent on page (although not by a large amount).
5. Test content length vs. content frequency
One of my biggest challenges as a blogger is balancing content length and content frequency. It’s proven that, on average, longer posts generate more shares, links and traffic.
At the same time, increasing content frequency can also boost engagement, providing that the content is scaled while maintaining a degree of quality.
This brings us to a dilemma. We (or our team of writers) only have so many hours in a day to write content, so is it best to write one 2,000-word post, or two 1,000-word posts?
While there is no definitive answer, we can of course experiment to work out the point at which extra content generates diminishing returns.
Quick Sprout did an analysis like this comparing content length vs. average rankings, number of links and social shares. They found that the average length of an article that ranks #1 on Google is 2,416 words.
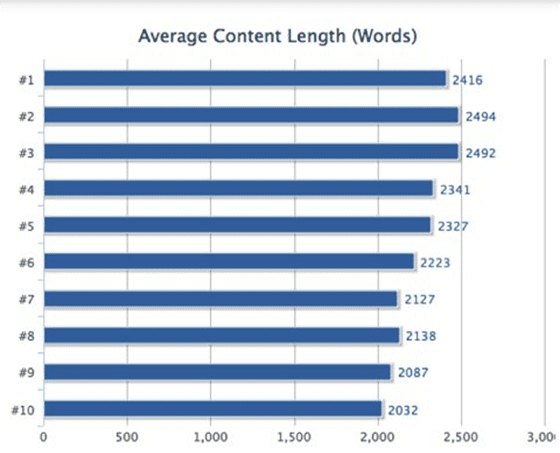
There are many limitations to this kind of analysis, but if you have enough content, you will notice a clear pattern of what length and frequency works best for your own blog.
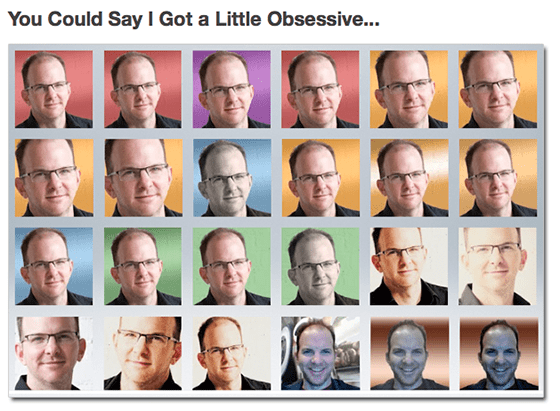
6. Test your profile photos
As emphasized earlier, we tend to judge books by their covers. As it turns out, we also judge people’s social profiles.
Rand Fishkin of Moz found that his rate of accrued followers on Twitter increased when he changed his Twitter profile picture as shown below.

While the images you use undoubtedly contribute to how people perceive your social profile, there are of course a number of other factors, from your bio to your most recent tweets and shares.
A few years ago, Cyrus Shepherd ran an interesting experiment to determine the impact of his Google+ photo on the CTR of his articles.
What he found was that changing his profile photo increased his SERP CTR by 56%. While kind of obsolete after the recent announcement that Google is dropping author photos from search results, this example illustrates that our photos can influence our CTRs.
When creating your profiles, be aware that the images you use and how you describe yourself will impact the rate of followers and engagement that you acquire. And when in doubt, test.
7. Test open graph and Twitter card data
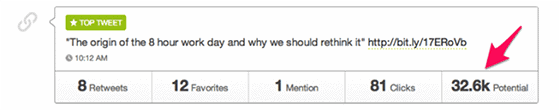
We’ve already discussed how much impact your headlines have on determining whether your post generates tens or thousands of shares, but what about everything else that determines whether someone does or doesn’t click on your link?
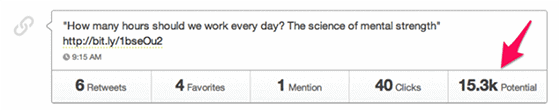
As an example, take this post that just came up in my newsfeed.
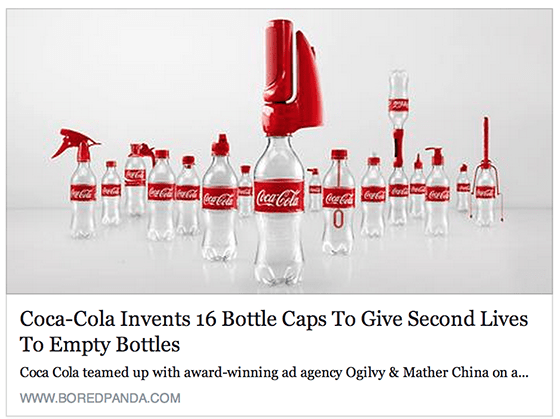
There are eight aspects of this post which determine my likelihood to click:
- Who posted it
- The description they wrote about it
- The post image
- The post headline
- The post description
- The host domain
- How many people have liked it
- The comments (or lack of)
The publisher has control over many of these elements and can optimize them to increase my likelihood of clicking.
The easiest way to experiment with these different elements is by running a Facebook ad or promoted tweet campaign where everything is identical except for one variable (whether the image, description or headline).
AdEspresso ran a split test like this and found that a small change in their post’s description made a big difference: one variation generated 0 likes and the other generated 70.
Finding the best combination of elements that drive the highest click through rates and engagement is a matter of trial and error, but finding the sweet spot can pay off exponentially.
Optimize for humans, not for robots
As the recent controversy over Facebook’s social experiments has shown, people do not take kindly to being manipulated emotionally. Make sure you don’t cross that line.
Conversion rate optimization does not account for how people feel. It only cares about what people do – and how your audience feels is important.
I hope these ideas have been useful. If you’ve run any interesting experiments around social engagement, feel free to share them in the comments below.
Hear Marcus on the Call to Action podcast:
