A/B testing analysis tends to get glossed over in a ton of how-to guides, if it gets covered at all. But this is a crucial part of your testing process—it ensures you’re making decisions based on evidence, not on a hunch or gut feeling.
In this post, we’re going to give you a primer on how to analyze and interpret the results of your A/B tests.
Whether you’re an A/B testing rookie or a seasoned veteran in need of a refresher, we’ll cover everything you need to know about analyzing your test results and putting them to work for your business.
Let’s dig in!
What is A/B testing analysis?
A/B test analysis is the process of evaluating and assessing the results of a split test to determine which variant of a tested asset (a landing page, email, CTA, or paid ad) performs better, according to metrics you defined at the start of your test.
Or, in the simplest terms possible, it’s a debrief process for your tests.

But this process is more involved than looking at which variant won the test. It’s about asking why something occurred and conducting a detailed analysis of your data to figure out what’s going on and why something is working (or not working).
As tempting as it might be to look at the winning variant and immediately implement it throughout your marketing strategy, A/B test analysis focuses on uncovering the lessons learned and other findings from your test.
Although your conversion rate will be the main lens you analyze your results through, there are many, many KPIs that you’ll probably want to take a look at. Think click-through rate, bounce rate, and revenue, among many others.
And beyond this, proper analysis is also about making sure your results are valid and statistically significant—there’s always a chance that the results you see are a random occurrence. Ensuring this chance is as low as possible is critical for reliable data.
TABLE OF CONTENTS
Josh Gallant
Josh is the founder of Backstage SEO, an organic growth firm that helps SaaS companies capture demand. He’s a self-proclaimed spreadsheet nerd by day, volunteer soccer coach on weekends, and wannabe fantasy football expert every fall.
» More blog posts by
Josh Gallant
Why is it important to interpret A/B test results accurately?
Accurate interpretation of your A/B tests helps ensure the data you’re looking at is relevant, useful, and representative of your wider audience. Specifically, you should interpret your data properly for several key reasons.
1. Avoiding false positives
Any misinterpretation of your data can lead to a false positive—where you see a difference between your results when there isn’t one. The results of a false positive have far-reaching effects, causing problems with your overall strategy, lost time, lost resources, or worse.
2. Informed decision making
You need accurate data and interpretation to make sure that the decisions you’re making are based on real, genuine performance rather than any assumptions or hunches you may have. This is necessary for effective strategies, an optimized user experience, and a better return on investment (ROI) for your marketing efforts.
3. Understanding user behavior
Proper analysis helps you delve deeper into how different segments of your audience interact with the variations being tested. This can give you valuable insights into user preferences, pain points, and behaviors, in turn helping you to tailor your marketing efforts all the more effectively.
4. Ensuring statistical significance
Statistical significance is a complex topic full of mathematical formulas, but the long and short of it is: If your results aren’t statistically significant, they’re not entirely reliable. You need to be able to verify that your results aren’t the product of random chance, and analyzing your A/B testing data for statistical significance helps you ensure your findings are valid and can be used.
5. Driving continuous improvement
A/B testing isn’t a one-off activity, but an ongoing process marketers use as part of their conversion rate optimization efforts. Analyzing your results is a key component of this process, and it helps support continuous testing and the drive for continuous improvement throughout your business. Put simply, if you can trust your data, you’re more likely to keep at it and continue to iterate and enhance—leading to big gains over time.
6. Maximizing resource efficiency
By understanding which variations truly work and which don’t, you can allocate your resources more efficiently, focusing your marketing efforts on those tactics and campaigns that are proven to drive results—all without overhauling everything. This is especially important when marketing budgets are tight and every dollar counts.
How to interpret A/B testing results?
Now that you’re up to speed on the basics of A/B testing analysis, it’s time to learn how to do it yourself. Remember, interpreting the results of your A/B tests is a systematic process that can be broken down into 6 key steps:
- Compare your test results against the right metrics and KPIs
- Determine if your tests are statistically significant
- Analyze your A/B test’s sample size and duration
- Assess any external and internal factors
- Segment your audience
- Take action based on your results
Step 1: Compare your test results against the right metrics and KPIs
You need to evaluate and assess your data based on key metrics and benchmarks to determine what elements are working, what elements need to be changed, and to learn more about how your pages are performing.
When analyzing A/B test results, it’s essential to focus on metrics that directly align with your business objectives. Not sure where to start? Here are a few key metrics to consider:
- Conversion rate: The percentage of visitors who complete a desired action, like making a purchase or signing up for a newsletter. A higher conversion rate likely means your variant is driving the intended behavior.
- Bounce rate: The percentage of visitors who leave after viewing one page. You want this to be low, indicating users are engaging more with your content.
- Click-through rate (CTR): The percentage of visitors who click a specific link or CTA. High CTRs mean your messaging or design is resonating with your audience. It’s different from conversion rate, which tracks the final goal.
- Scroll depth: Shows how far visitors scroll on a page. Combined with bounce rate, it helps identify where users lose interest, helping you improve your pages.
- Abandonment rate: Tracks how many visitors start but don’t finish an action, like filling out a form or making a purchase. A high rate suggests user experience issues.
- Retention rate: Measures the percentage of users who return to your site after their first visit, indicating satisfaction and loyalty.
- Session duration: Tracks how long visitors spend on your site. Longer durations usually show high interest in your content or products.
- Average order value (AOV): The average amount spent per transaction. A higher AOV suggests upselling or cross-selling efforts are working.
- Churn rate: The percentage of customers who stop doing business with you. Reducing churn is key for subscription-based services.
- Revenue: The total revenue from your pages, reflecting the impact of your testing on your bottom line. Big jumps in revenue are always the goal.
Step 2: Determine if your tests are statistically significant
This step could be a whole article all on its own. Figuring out whether or not your A/B test results are statistically significant is most often a process that the testing tools you use will do for you because doing it manually means you have to get your hands dirty calculating statistics.
(All power to you, if that’s your jam!)
That said, understanding the principles at work behind your statistical significance calculations can help you get a better sense of what tests and experiments will be reliable and easy to follow.
The big thing with statistical significance is that it generates a p-value, which is a measure of the probability that your test’s results are a product of chance and not the actions you’ve taken. For most cases, you want a p-value of 0.05, or 5%, at most.
If you run the numbers and your p-value comes in under those figures, great! You can be confident that your test is reliable and the data is usable.
Step 3: Analyze your A/B test’s sample size and duration
How reliable your A/B test results are is also a product of your sample size and the length of time your test ran for. Typically, you’ll figure these things out before you run your test, but it’s worth double-checking during your analysis.
If your sample size is too small, you probably don’t have enough data to make informed decisions—and the same goes if your test stopped too soon. Both carry a risk of leading to inconclusive or misleading data.
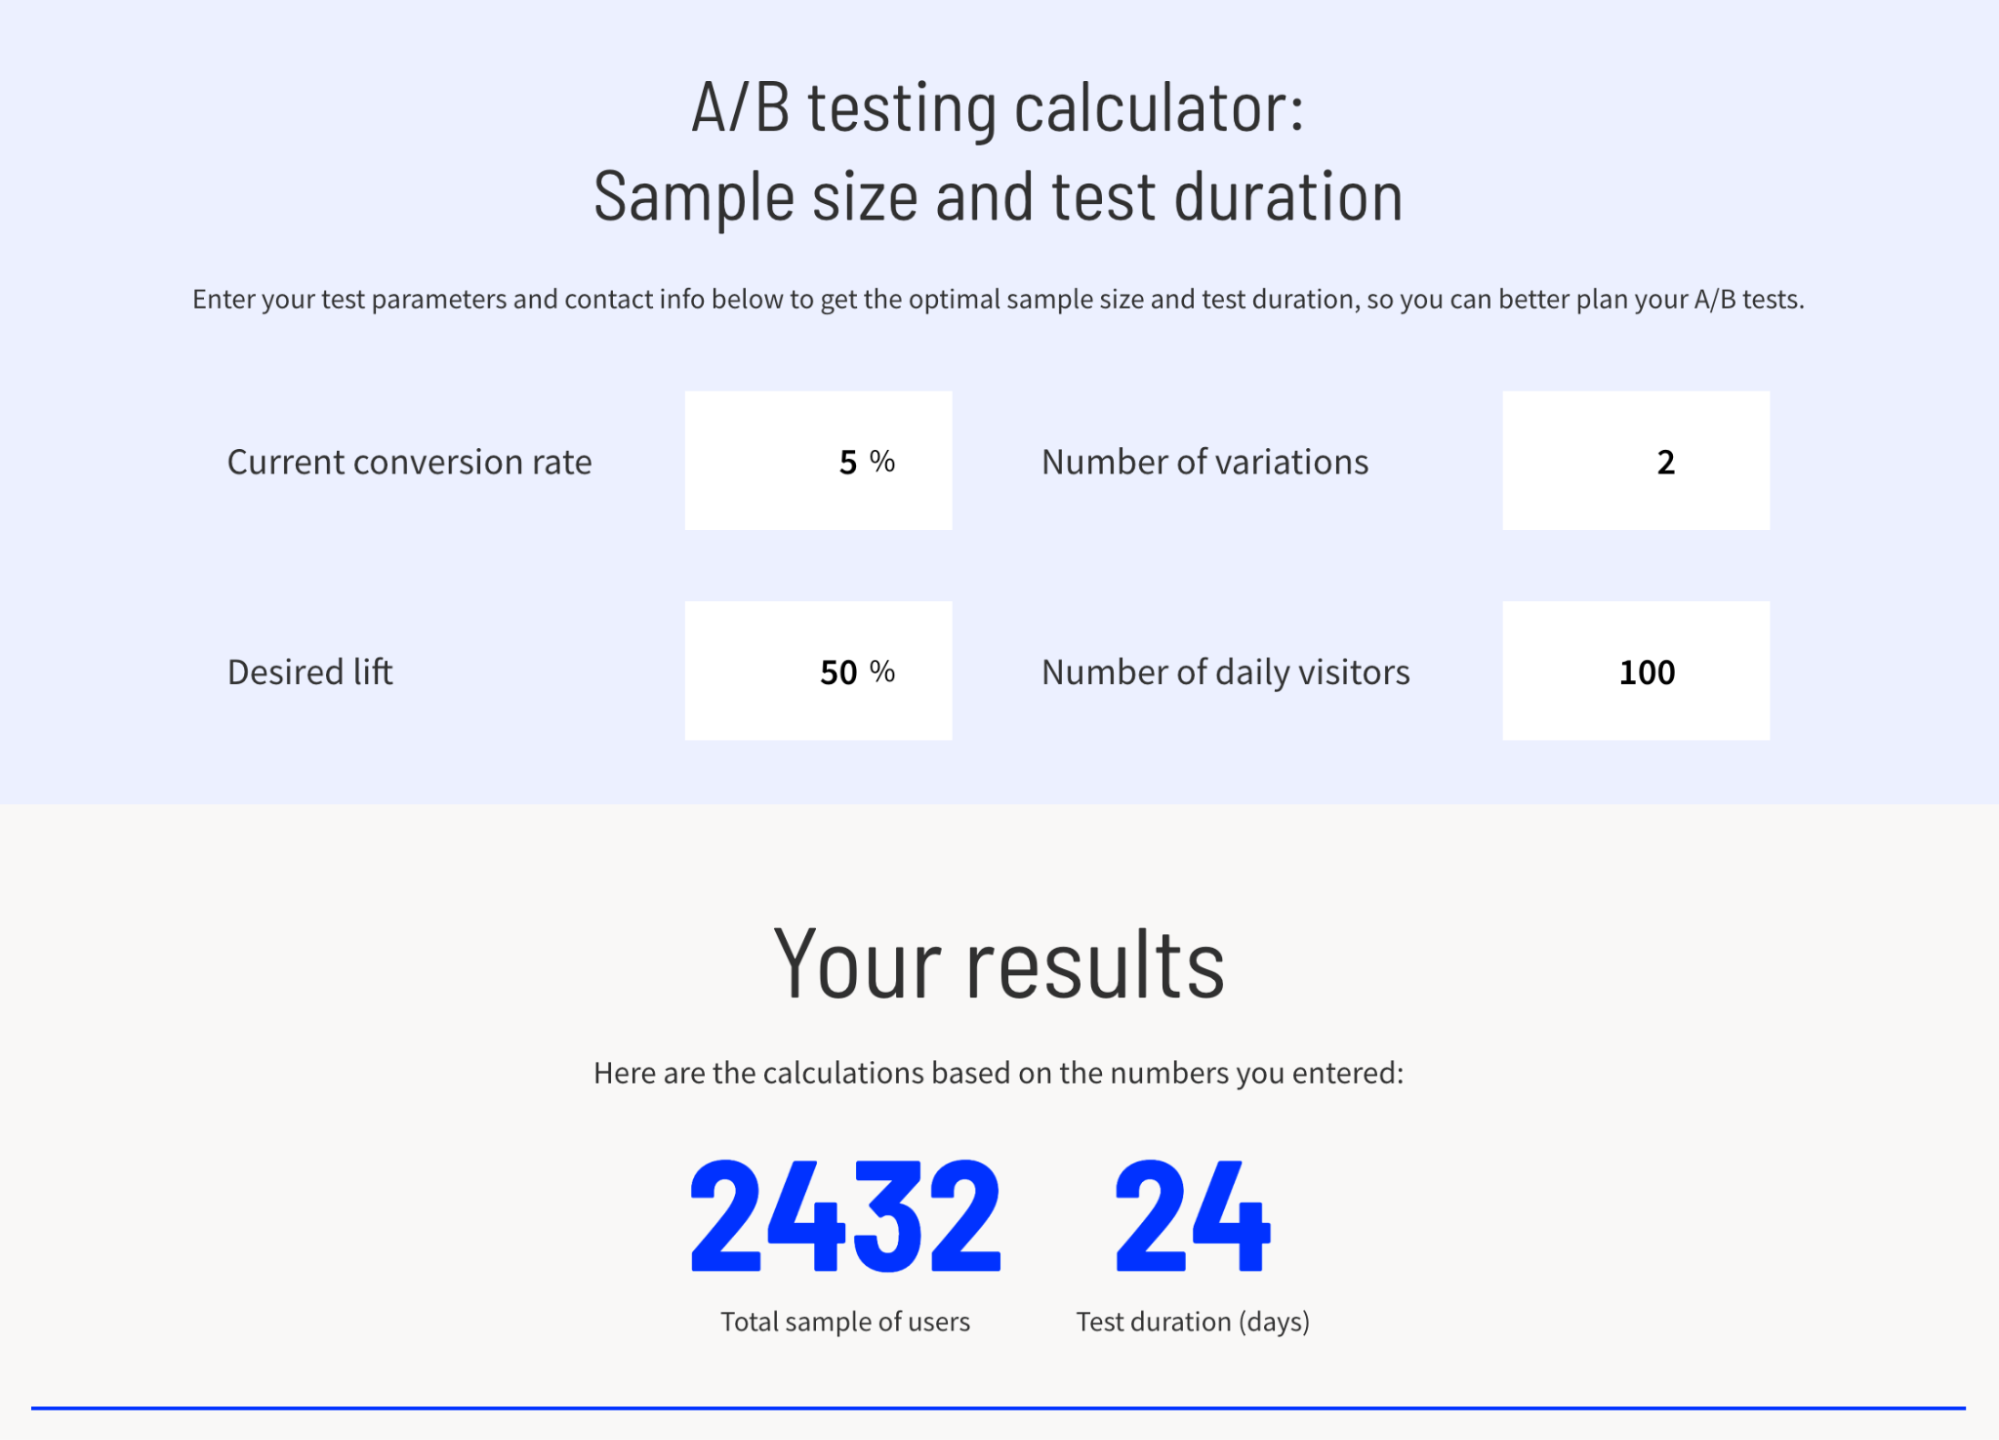
To figure out the appropriate sample size, we recommend using an A/B test calculator that handles the numbers on your behalf. You can check out Unbounce’s sample size and test duration calculator for yourself when you’re ready to crunch the numbers.
Step 4: Assess any external and internal factors
Part of your analysis will involve looking at influencing factors—external and internal alike. These factors could lead to skewed results and data, in turn leading you to make faulty assumptions and findings.
Some of the main factors you should look at include:
- Seasonality: User behavior can vary significantly depending on the time of year. For example, ecommerce sites often see spikes in traffic and conversions during the holiday season. If your test coincides with times of Yuletide cheer, it’s important to take this into account when interpreting your results.
- Marketing campaigns: Any ongoing marketing campaigns that drive traffic to your site can affect the results of your A/B test. For instance, a campaign promoting a discount could lead to higher conversion rates… but it may not be sustainable once the promotion ends.
- Technical issues: Technical problems on your site, like long load times or broken links, could negatively impact user experience and therefore skew your test results. That’s why it’s important to ensure that any technical issues are resolved well before running your test, let alone analyzing the data.
Step 5: Segment your audience
Segmenting your audience is a great way to help focus your marketing efforts and better reach your customers—but you can also do it during your test analysis.
Segmenting your audience is just a way of breaking your visitors up into different groups, either by demographics (think age range, gender) or behavior (when they visit your page, the devices used, the action taken). You can split your audience into any number of smaller subsets depending on your needs.
This gives you a better sense of what variants are performing better amongst these subsets, giving you further opportunity to tailor your marketing strategies to each segment. This is a great way to zero in on the wants and needs of your customers.
If a page is getting most of its visitors on mobile, but the mobile version isn’t converting as well as desktop, you might consider optimizing the mobile version first and foremost. Similarly, if a particular variant performs exceptionally well with mobile users but not as well with desktop users, it could be worth focusing on improving the desktop experience.
Also, if a variant resonates more with new visitors than returning ones, that’s probably a sign you need to rethink the experience for returning customers.
Step 6: Take action based on your results
The final step in your analysis is to take action.
If the test has shown a clear winner, and you’ve confirmed the data is valid and reliable, then you can be confident it’s worth implementing elsewhere.
That said, if you’ve got inconclusive results, then you may need to run further tests across your pages and campaigns. Whatever you do, document your findings and share them with your team or other stakeholders to make sure everyone can benefit.
This sort of documentation is a goldmine for future tests, letting you build a strong foundation of data to track your progress and compare current performance to past benchmarks.
What to do after analyzing your A/B testing results
Now that you understand how to analyze your A/B testing results, you’re probably wondering…
Next, you need to act on your findings.
Remember, the point of A/B testing is to drive improvement in your marketing efforts. To that end, once you’ve got your results, you’ll most often do the following:
Implement winning variants
If there’s a winning variant, it’s statistically significant, and your findings confirm your hypothesis, awesome! It’s time to implement that winning variant where applicable.
This is, basically, the process of making a variant’s changes permanent and consistent. In some cases, this is a pretty simple tweak to a landing page or ad—but in others, you could be making more substantial changes throughout your entire conversion funnel.
Regardless, take the time to implement these changes, and then monitor the changes after the fact to spot any hiccups or issues that might arise.
Measure the impact of any changes made
Once the winning variation is live, you’ve now got to measure its impact over time.
Keep on tracking those key metrics you measured during the original A/B test to ensure that your changes are delivering the results you expect. This continued tracking will help you confirm that, yes, your improvements are more than a flash-in-the-pan fluctuation.
Remember, continued success is the name of the game! Keep tracking and measuring to make sure you’re achieving your goals and that everything is running smoothly.
Create a framework to support ongoing testing
We’ve said it before, we’ll say it again—A/B testing is an ongoing process of continuous improvement, not a one-off activity.
That’s why it’s so important you set up a framework to support your ongoing testing efforts, so you can use it to foster and support a culture of data-driven decision making and experimentation.
Best of all, creating this sort of framework is easier than you think:
- Establish regular testing cycles
- Document results
- Report on findings and share with colleagues
- Implement it all
Continuous testing allows you to iterate on your successes and address any areas that still need improvement.
What to do if you have a failed A/B test
Not every A/B test will produce a winning variation. Sometimes, you’re left with inconclusive results, and in other cases, you’re left with a “losing” variant.
The fact is that even a failed test gives you valuable, usable data. A lot of the lingo of A/B testing focuses on things like “champion” and “winning,” but those are just useful terms to help you track what you’re doing.
If you’re stuck with an inconclusive test, don’t worry. You’re still learning, and you just need to go back to the drawing board. Here’s what to do:
Analyze the data
Even a failed A/B test can provide valuable insights. Take a close look at the data to understand why the test didn’t yield the expected results.
Were there any external factors that could have influenced the outcome? Did the test run long enough to reach statistical significance? Did the sample size meet the required threshold? Answering these questions can help you refine your approach for future tests.
Adjust your hypothesis
A failed test could indicate that your initial hypothesis was incorrect or that the changes you made weren’t significant enough to impact user behavior (this is your reminder to not play it safe with A/B tests).
Take some time to revise your hypothesis and run a new test with different variables. Alternatively, you might decide to focus on a different aspect of your marketing strategy that could yield better results.
Learn and iterate
The most important thing to remember is that a failed A/B test is not a waste of time. Every test provides an opportunity to learn more about your audience and refine your approach. Use the insights gained from the failed test to inform your future experiments, and don’t be afraid to iterate on your ideas until you find a winning solution!
Common A/B testing mistakes to avoid
To get the most out of your A/B tests, you need to avoid common mistakes that can lead to unreliable results. Here are a few pitfalls to watch out for:
Testing too many variables at once
Testing multiple variables simultaneously can make it difficult to determine which changes are driving the observed results. To avoid this, focus on one variable at a time, or consider running multivariate tests if you absolutely need to test multiple elements together.
Ending tests too early
It can be tempting to end a test as soon as you see positive results, but doing so can lead to inaccurate conclusions. Make sure to run your tests for a sufficient duration to account for variations in user behavior over time, and ensure that your results are statistically significant before making any decisions.
Ignoring segmentation
Failing to segment your audience during analysis can lead to missed opportunities. Different user groups may respond differently to variations, so it’s important to analyze your results by segment to gain a deeper understanding of what works for specific audiences.
Not setting clear goals
Without clear goals, it’s impossible to measure the success of your A/B test accurately. Before you start testing, define your objectives and the key metrics you’ll use to evaluate the results. This will help ensure that your tests are focused and aligned with your overall business strategy.