
CRO analytics: How to measure your CRO efforts the right way
Ever feel like you’re drowning in data but can’t find a single useful insight? Yeah, we’ve been there too.
Here’s the thing:
Most marketers treat analytics as an afterthought—something to check once campaigns are already live and running. Big mistake. The truth? Effective conversion rate optimization measurement starts before you run your first test. Not after.
Want to know the real difference between companies that see steady conversion improvements and those stuck in the mud? It’s all about how they approach measurement from the get-go.
TABLE OF CONTENTS

Josh Gallant
Josh is the founder of Backstage SEO, an organic growth firm that helps SaaS companies capture demand. He’s a self-proclaimed spreadsheet nerd by day, volunteer soccer coach on weekends, and wannabe fantasy football expert every fall.
» More blog posts by Josh Gallant
In this guide, we’re breaking down the key steps to building a conversion-focused analytics workflow that actually drives results (no fluff, promise). You’ll learn:
- How to set goals that actually connect to your bottom line
- Which metrics matter (and which ones are just vanity numbers)
- Why qualitative context makes or breaks your data
- How to build tests based on real insights, not hunches
- Ways to make analytics an everyday habit, not a quarterly chore
Look, whether you’re just dipping your toes into CRO or you’re looking to take your current approach up a notch, these strategies will help you measure what matters and turn those insights into real action.
Ready to stop guessing and start growing? Let’s dive in.
Step 1: Define what success looks like for your CRO strategy
When it comes to CRO, there’s nothing worse than celebrating “wins” that don’t actually move the needle. Been there? We have too.
Before you open a single analytics dashboard or peek at a heatmap, you need to get crystal clear on what conversion success means for your specific business. This isn’t just about picking random KPIs—it’s about defining real outcomes that impact your bottom line.
The median conversion rate across all industries is 6.6%. But what does that really mean for you? Let’s break it down.
Set outcome-focused CRO goals, not just KPIs
Most companies start with vague goals like “improve conversion rate” or “get more leads.” That’s like saying you want to “make more money”—who doesn’t?
Here’s what real, outcome-focused CRO goals look like:
- “Increase product demo bookings from 2% to 3% of visitors”
- “Improve lead form completions by 20% for our highest-value landing page”
- “Reduce cart abandonment from 75% to 65% for mobile users”
See the difference? These goals tie directly to business outcomes and give you clear targets to measure against.
When setting your conversion goals, make sure to align them with your sales process stages. For example, if you know that 10% of qualified leads become customers, and you need 50 new customers per month, you can work backward to determine you need 500 qualified leads.
Compare your current conversion rates against industry benchmarks, but don’t obsess over them. Email traffic converts at an average of 19.3%—significantly outperforming paid social (12%) and paid search (10.9%). Use these numbers as a reality check, not an absolute standard.
The right goals set the foundation for everything that follows. Without them, you’ll waste time optimizing for metrics that don’t actually increase your conversion rates or drive meaningful business growth.
Want to see how this works for ecommerce specifically? Check out our guide to optimizing Shopify landing pages for real-world examples of outcome-focused goals.
Track micro conversions to capture early intent (not just macro conversions)
Not every visitor is ready to buy today. That’s why tracking only macro conversions (purchases, sign-ups, form submissions) is like only measuring home runs in baseball—you miss a lot of valuable activity.
Micro conversions are smaller actions that signal interest and intent earlier in the customer journey. They’re the singles and doubles that eventually lead to those home runs.
Some powerful micro conversions worth tracking:
- Email newsletter sign-ups
- PDF or resource downloads
- Product page views (especially repeat visits)
- Video views (especially completion rates)
- Add-to-cart actions
- Blog comment submissions
- Calculator or tool usage
- Scroll depth on key pages (did they reach your value proposition?)
- Time spent on pricing pages
By tracking these smaller actions, you gain visibility into where friction begins in your conversion funnel—often long before major conversion drops become visible.
For example, if visitors watch your product demo video but don’t request a live demo afterward, that’s a signal there might be a disconnect between what the video promises and what the form asks for.
Pro tip:
Don’t track every possible micro conversion—you’ll drown in data. Instead, map your customer journey and identify 3-5 key actions that strongly correlate with eventual conversion. Focus there first.
Creating a clear measurement framework—from micro to macro conversions—gives you the full picture of how visitors become customers. This is especially critical for B2B landing pages where the path to conversion is often longer and more complex.
The real magic happens when you start optimizing your lead generation forms based on those micro conversion insights—turning small signals into major conversion wins.
Step 2: Decide which metrics actually matter
Let’s be honest—most analytics dashboards are like all-you-can-eat buffets. Too many options, and you’ll end up with a stomachache.
It’s easy to get lost in the sea of numbers and fancy charts. But here’s the truth:
Not all metrics deserve your attention. Some are just vanity metrics that make you feel good without telling you anything useful.
This step is about cutting through the noise and zeroing in on the data points that actually drive conversion insights. Let’s get picky about what we measure.
Use funnel reports to spot drop-off points and step-by-step conversion rates
Think of your conversion path as a leaky bucket. Water goes in the top (visitors land on your page), but only some makes it to the bottom (conversions). Your job? Find and fix the holes.
Funnel reports are your x-ray vision into this process. They show you exactly where visitors bail out:
- Landing page → 100% (everyone starts here)
- Scroll to pricing section → 60% (uh-oh, lost 40% already)
- Add to cart → 20% (another big drop)
- Checkout page → 10% (ouch)
- Confirmation page → 2% (your final conversion rate)
See those steep drop-offs? Each one is a glaring opportunity. For instance, that 40% drop between pricing and cart? Something in your pricing section is scaring people away. Fix that, and you could dramatically lift your overall conversion rate.
Pro tip: Create separate funnels for different traffic sources. Your social media visitors might drop off at different points than your email subscribers. Knowing these patterns helps you tailor your approach for each channel.
The magic of a good conversion funnel analysis is that it transforms a vague “our conversion rate is low” problem into a specific “we lose 40% of visitors on the pricing page” problem. And specific problems are ones you can actually solve.
Want to take this to the next level? Try setting up landing page sales funnels that target different stages of awareness, so you can measure how effectively you’re moving prospects through each decision phase.
Filter out noisy or misleading data (especially from Google Analytics)
Not all data tells the truth. Some of it straight-up lies to your face.
Take bounce rate, for example. A high bounce rate might mean your page is terrible… or it might mean visitors found exactly what they needed and left happy. Context matters.
Here are some common data traps to watch for, especially if you’re poking around in all of the standard Google Analytics reports:
- Inflated time-on-site metrics: If someone opens your page in a tab and forgets about it for an hour while scrolling TikTok, that doesn’t mean they spent an hour deeply engaged with your content.
- Misleading bounce rates: Single-page visits aren’t always bad. If your landing page’s goal is to get people to call you, and they do, that’s still technically a “bounce”—but a successful one.
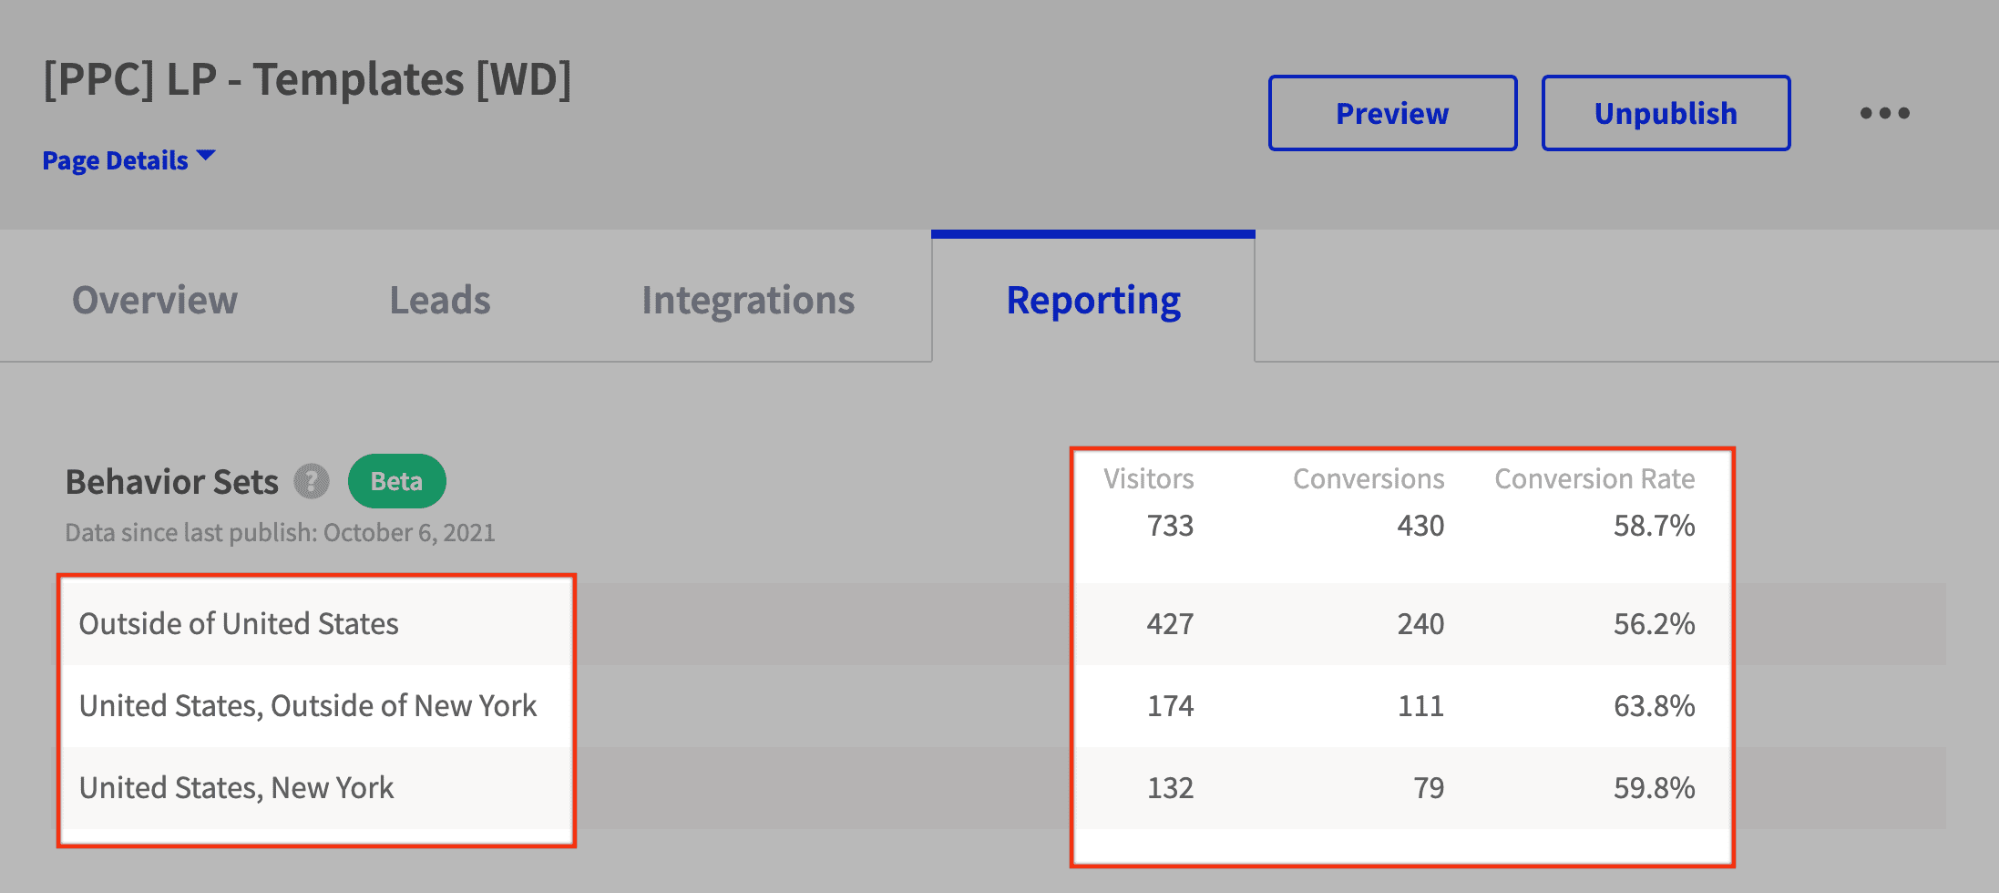
- Overall averages that hide problems: Your overall average conversion rate might look decent, but when segmented by device, you might discover your mobile experience is a disaster zone.
- Sessions vs. users confusion: One person visiting 5 times counts as 5 sessions but only 1 user. Mixing these up can lead to wildly different conclusions.
The fix?
Get ruthless about segmentation. Break down your data by:
- Traffic source (organic, paid, social, email)
- Device type (desktop, tablet, mobile)
- New vs. returning website visitors
- Landing page type
This approach helps you spot the real reasons behind high bounce rates and other conversion killers. For example, pages with high word complexity show a -24.3% correlation with conversion rates—something you’d never catch without proper segmentation.
Speaking of getting the right granular data, we’ve all been there—trying to make sense of metrics that feel like they were designed by a sadistic statistics professor.
(Unbounce’s landing page and A/B testing dashboards and custom reports, on the other hand, are designed for actual humans who don’t have PhDs in data science… just saying.)
The key is focusing on metrics that actually move the needle for your business goals, not just the ones that are easy to track.
Here’s a perfect example:
When you look at your landing page performance as a whole, everything might seem fine. But dig a wee bit deeper and you might find surprises. One common one—according to the 2024 Conversion Benchmark Report, 83% of landing page visits happen on mobile, but desktop actually converts 8% better. Without breaking down your data by device using device reports, you’d miss this completely.
Step 3: Add qualitative user behavior context to the numbers
Numbers tell you what’s happening. But they don’t tell you why.
Let’s face it:
Look, your fancy charts and graphs won’t tell you why someone bounced after 5 seconds or what made them bail right before hitting “Buy Now.” That’s the blind spot in pure data analysis. You need the story behind those numbers.
Enter qualitative research.
Think of it as mind-reading for marketers. Not in a creepy way—more like finally understanding what’s actually going on in your visitors’ heads. To measure CRO effectively, you need both quantitative metrics (the what) and qualitative insights (the why).
Use heatmaps and recordings to find friction
Ever wish you could look over your visitors’ shoulders as they browse your site? Well, you basically can.
Heatmaps and session recordings are one of the best ways to analyze visitor behavior somewhat at scale. They show you exactly where people click, how far they scroll, and where they get stuck.
Here’s what to look for with each:
Heatmap red flags:
- Cold spots on important CTAs (nobody’s clicking them)
- Lots of clicks on non-clickable elements (frustration alert!)
- Scroll maps that show people never reaching key information
- Mouse movement concentration in unexpected areas
- Click patterns that differ dramatically between converting and non-converting visitors
Session recording warning signs:
- Rage clicks (rapid, repeated clicking on an element)
- Confused mouse movement (the digital equivalent of a furrowed brow)
- Form field abandonment (they start typing, then bail)
- Excessive scrolling up and down (they’re lost)
- Back button hits immediately after page load (instant rejection)
Imagine discovering through heatmaps that visitors are repeatedly clicking on product images, expecting them to enlarge—but nothing happens. This is the kind of insight that explains why people might be leaving your site frustrated. Adding image zoom functionality could be a simple fix that significantly boosts your add-to-cart rate.
Don’t just look at overall patterns—segment your recordings by device type too. Again, given that 83% of landing page visits happen on mobile, yet desktop converts 8% better on average, you might spot crucial friction points unique to smartphone users.
These visual tools are particularly helpful when optimizing landing page experiences. For example, you might discover that your perfectly crafted CTA button sits just below the fold on mobile devices—a simple fix that could dramatically lift conversions.
Want to take user behavior insights to the next level? Consider how these learnings could improve your popup design and targeting as well. Maybe your popup appears at the wrong moment in the user journey, or asks for too much information too soon.
Gather voice-of-customer insights through surveys
Heatmaps and session recordings show you what users do. But to understand why they do it, you need to hear from them directly.
Enter user surveys—your direct line to your visitors’ thoughts and feelings.
The beauty of surveys is their simplicity. With just a few targeted questions, you can uncover conversion blockers that might take months to identify through A/B testing or multivariate testing alone.
Here are some high-impact survey questions that reveal conversion barriers:
- “What’s stopping you from making a purchase today?”
- “What questions do you still have that aren’t answered on this page?”
- “What nearly stopped you from signing up?” (ask after conversion)
- “How would you describe this product/service to a friend?”
- “What’s one thing we could do to make this decision easier for you?”
Tools like Hotjar, SurveyMonkey, and Google Forms make it easy to create and deploy these surveys. You can also use on-page micro-surveys (those little question boxes that slide in at just the right moment) to capture real-time-ish feedback.
For example, a simple exit survey might reveal that prospects are confused about whether your service includes phone support. Adding one clarifying line to your landing page could significantly increase conversions. These direct insights from customers often highlight quick wins you’d never discover through quantitative data alone.
These insights could even spark some inspiration for a future lead generation campaign. If you see the same questions or feedback coming up time and time again, that could be a trigger to create a content asset that addresses those specific pain points.
Pro tip: Don’t survey everyone. Target specific segments like:
- Visitors who spent over 3 minutes on site but didn’t convert
- Return visitors who still haven’t purchased
- People who added to cart but abandoned
- Recent converters (while the experience is fresh)
The combination of what users do (quantitative) and what they say (qualitative) gives you a complete picture of your conversion landscape. And that sets you up perfectly for the next step: turning those insights into tests.
Step 4: Build tests on data-backed hypotheses
Ready to stop guessing and start testing? Good.
But hold up:
If you’re just throwing random ideas at the wall to see what sticks, you’re doing it wrong. The best CRO programs run tests based on actual evidence—not hunches, not what your CEO saw on a competitor’s site, and definitely not whatever happens to be trending on marketing Twitter (call it X if you want to) this week.
Craft hypothesis grounded in behavioral data
A real hypothesis isn’t just “let’s try a green button instead of blue.” It’s a specific prediction based on actual user data and behavior patterns. And it follows a simple formula:
“Because we observed [data/insight], if we [make this change], then [this metric] will [increase/decrease].”
Let’s break this down with a real example:
“Because we observed 60% of visitors scroll past our form without stopping (heatmap data), if we move the form above the fold and simplify it from 7 fields to 3, then our form completion rate will increase by at least 15%.”
See how different that is from “let’s try moving the form”?
Your hypothesis needs three key ingredients:
- An observation based on actual data (something you saw in your analytics, heatmaps, or user feedback)
- A specific change you’re proposing to address the issue
- A measurable outcome you expect to see
Want to know the secret behind formulating an effective A/B test hypothesis? It’s all about connecting real behavioral insights to concrete predictions.
From there, when you’ve got a long list of test ideas (which you will after gathering all that data), you need a systematic way to decide what to tackle first. The smartest way to prioritize is to evaluate each test idea against two critical variables:
- Potential Impact: How much could this change move your conversion needle?
- Implementation Effort: How much time, resources, and technical work will this require?
This creates a simple 2×2 matrix that makes decision-making surprisingly clear:
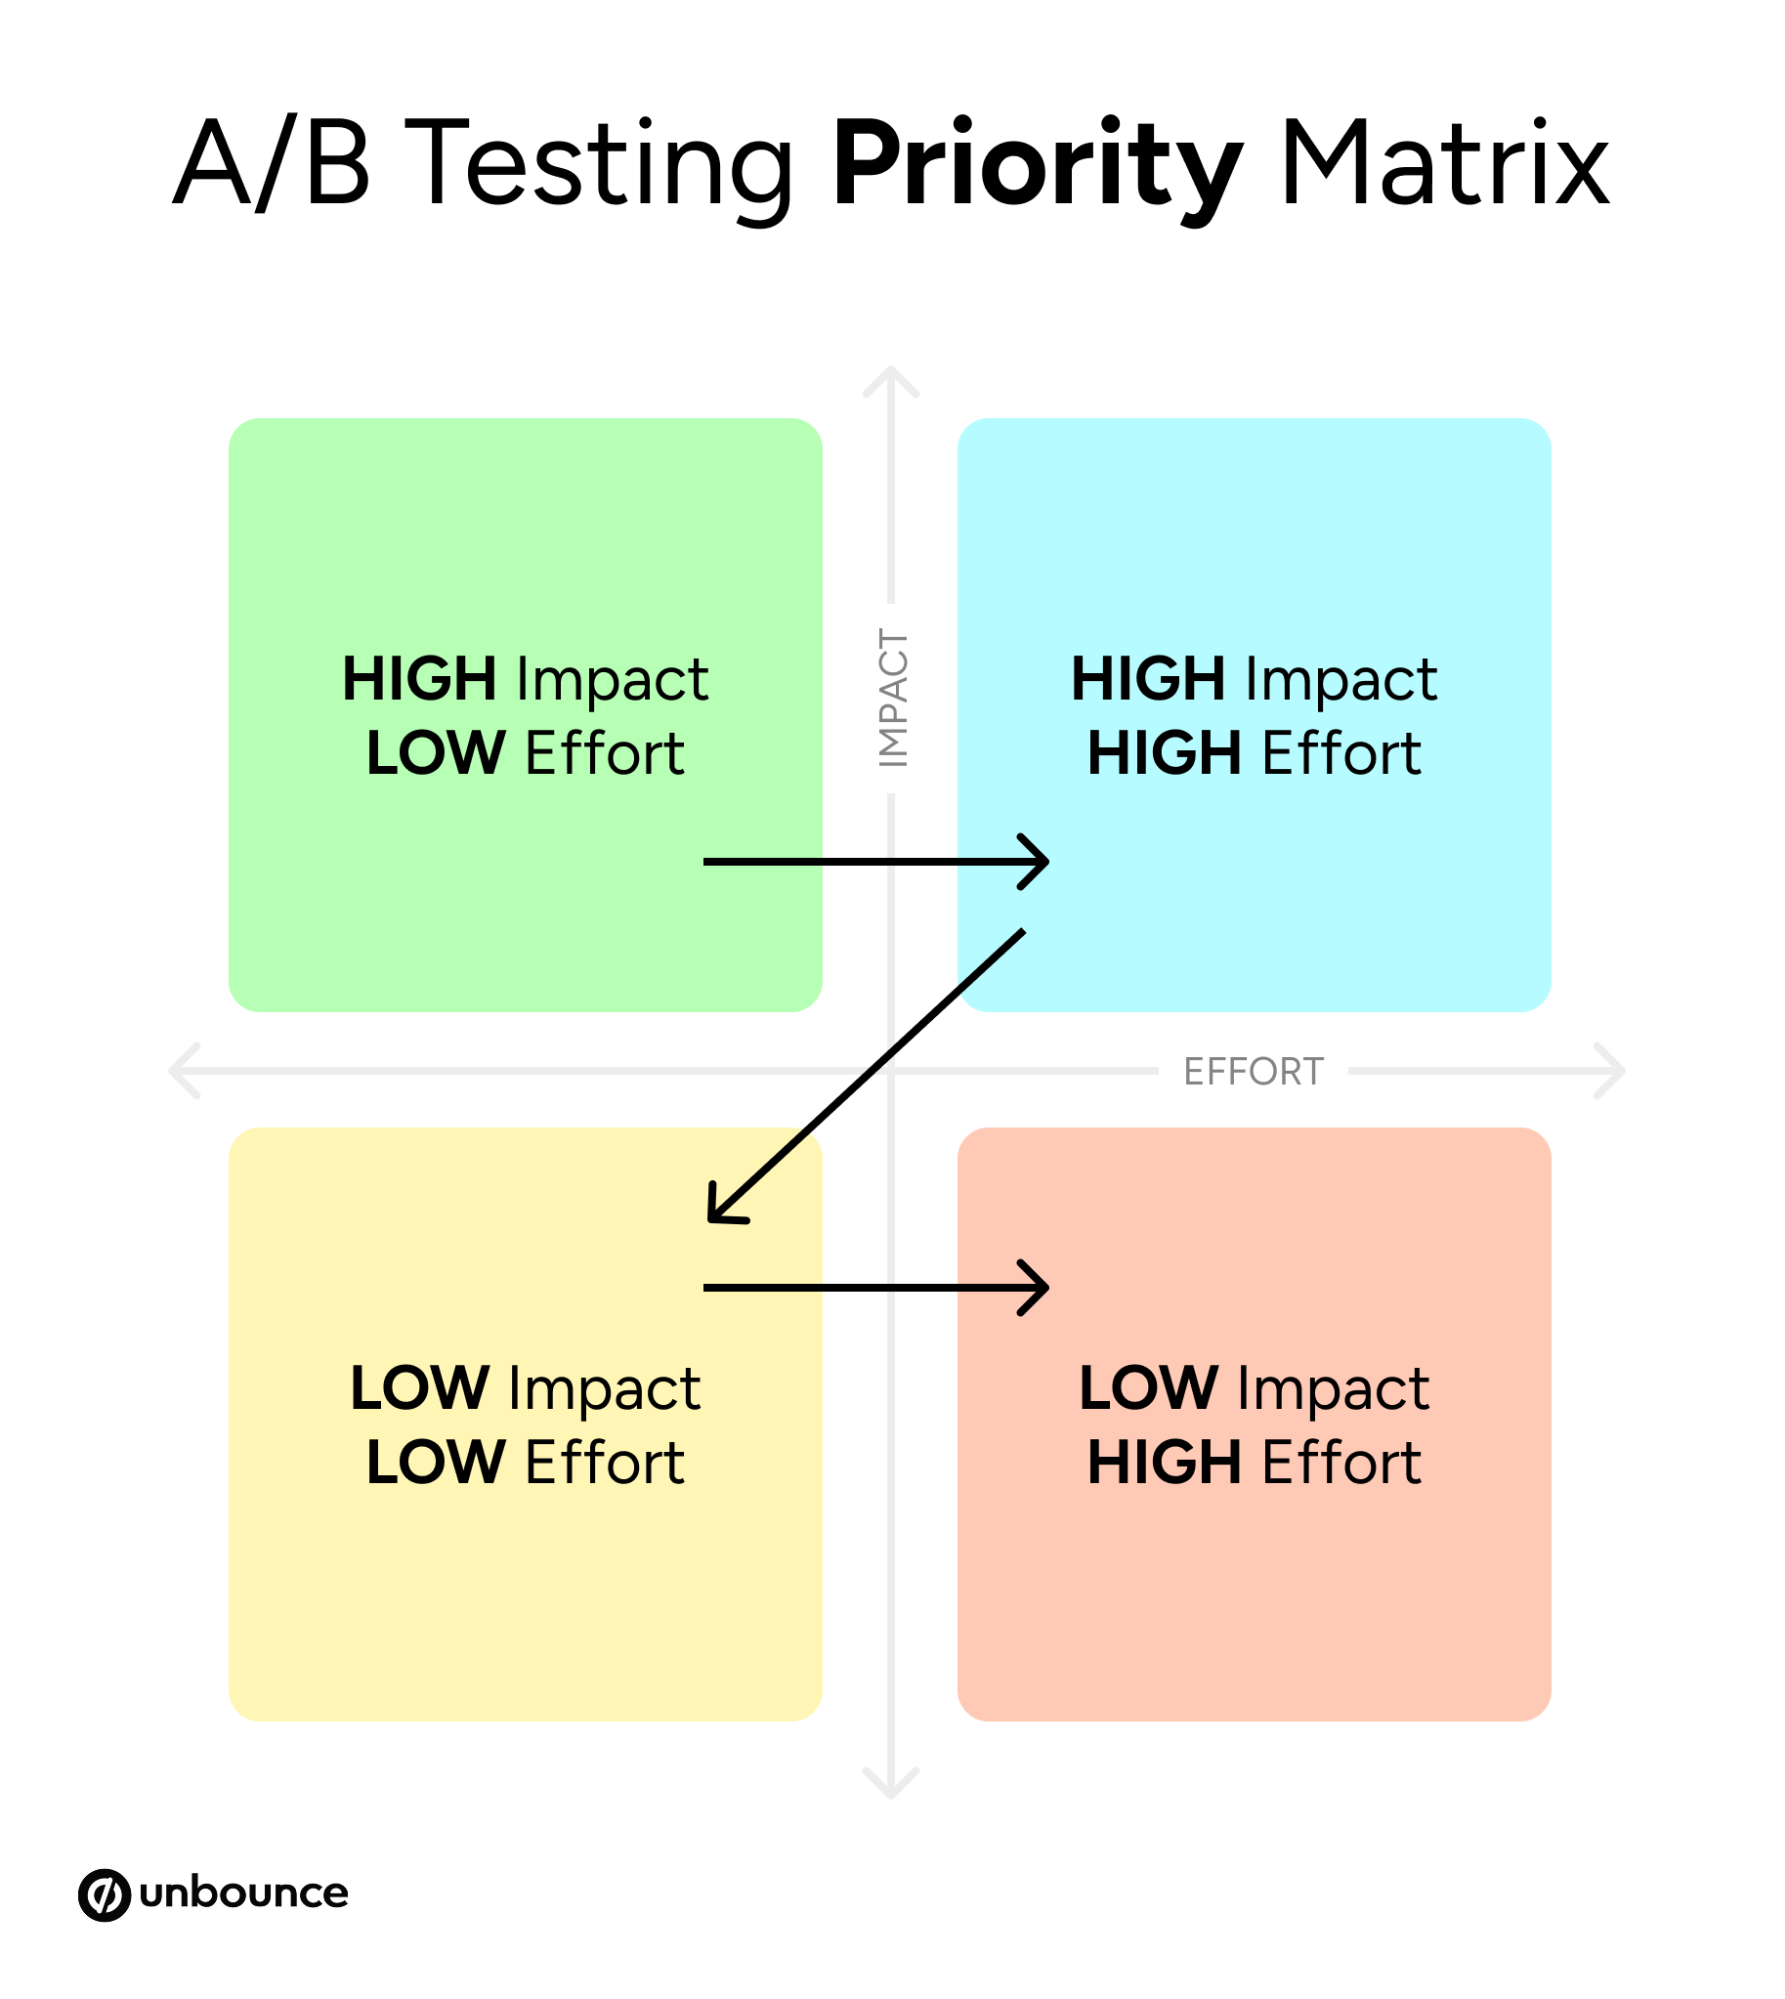
- High Impact/Low Effort: Start here! These quick wins deliver maximum value for minimal work.
- High Impact/High Effort: Plan these for when you have more resources—they’re worth the investment.
- Low Impact/Low Effort: Good for filling gaps between bigger projects.
- Low Impact/High Effort: Skip these entirely (seriously, don’t bother).
This framework should help you avoid the common trap of wasting weeks on complex tests that—even if successful—wouldn’t significantly impact your bottom line.
For more inspo, check out these A/B testing examples and case studies that show how real companies turned data insights into winning tests.
Interpret test results with real rigor
Here’s where we see plenty of marketers slip up:
They run a test, see variant B outperforming variant A by 5% in the first few days, then immediately declare “B wins!” and move on.
Not so fast.
That 5% lift could be pure chance or just early. Without statistical significance, you might be making decisions based on noise, not signal.
Statistical significance tells you how confident you can be that your results aren’t just random luck. It essentially helps you answer the question: “If there were actually no difference between versions A and B, what are the odds we’d see a difference this big by chance alone?”
Some key principles for interpreting test results:
- Wait for sufficient sample size: Don’t call tests early—it leads to false positives.
- Use an A/B test duration calculator: You can use an A/B test duration calculator to figure out how long you should be running your tests for.
- Look for 95% confidence minimum: This means there’s only a 5% chance your results are due to random chance.
- Consider practical significance: A 1% lift might be statistically significant, but is it worth implementing?
- Segment your results: Your new variant might work great for mobile users but tank desktop conversions.
- Watch for external factors: Seasonality, promotions, or news events can skew results.
Check out our guide on calculating statistical significance if you want to get deeper into the math (don’t worry, we keep it fairly simple and over-explain everything too).
Keep in mind, even “losing” tests give you valuable insights. A test that shows no difference between variants tells you that element might not matter as much as you thought—which is useful information for future optimization.
The goal isn’t just to find “winners” every time—it’s to build a deeper understanding of what drives your users to convert. Each test should leave you smarter than when you started, regardless of the outcome.
Step 5: Turn your CRO program into an ongoing habit
CRO isn’t a one-and-done project. It’s not something you do for a month, check the box, and move on.
The most successful companies don’t treat optimization as an event—they make it a habit. A discipline. A way of life. They build a culture of experimentation where testing becomes as routine as checking email.
Think about it:
If you only check your bank account once a year, you’re probably not managing your money very well. The same goes for your conversion optimization efforts. Let’s look at how to embed CRO into your everyday workflow—turning occasional tests into an ongoing system of growth.
Turn insights into continuous improvement
The most successful optimization programs share one key trait: they don’t just run occasional tests—they build a true culture of experimentation. When testing becomes part of your company’s DNA, each insight creates a ripple effect. Learnings from one experiment inform the next, creating a virtuous cycle of continuous improvement.
There’s a reason top marketers talk about having a structured CRO process—it’s the difference between random tests and a strategic system that drives consistent growth.
Here’s what a healthy CRO flywheel looks like:
- Analyze data from your highest traffic pages and user behavior
- Form hypotheses based on clear patterns and opportunities
- Run tests with variants focused on specific changes
- Measure results against your baseline metrics
- Apply learnings to other pages and campaigns
- Repeat—with each cycle making you smarter
The beauty of this approach is how it compounds over time. A 5% lift here, a 10% improvement there—these gains stack up. Before you know it, your conversion rates are multiples of what they were when you started.
Want to see how consistent optimization pays off? Check out these real-world landing page examples that demonstrate the power of relentless testing and improvement.
Remember, increasing your conversion rates isn’t about finding one magical fix—it’s about making dozens of small improvements based on real data and user behavior.
Some practical ways to make CRO a habit:
- Weekly check-ins: Spend 30 minutes every week reviewing your core metrics
- Monthly deep dives: Block a half-day to analyze trends and plan new tests
- Quarterly reviews: Zoom out to see long-term patterns and strategic opportunities
- Test debriefs: After each test concludes, document learnings for your team
One common misstep? Treating tests as isolated events rather than connected experiments. Each test should inform the next. That winning headline? Try it on other pages. That losing form layout? Avoid it elsewhere.
Want even more inspo to get started? Take a quick peek at our roundup of real CRO case studies where businesses of all shapes and sizes were able to boost their conversion rates.
Why the CRO tools in your toolkit are more important now than ever
Let’s get real—gut feelings and guesswork don’t cut it anymore when it comes to optimizing your pages. The entire online world these days is too competitive, crowded, and noisy for that.
Without the right tools, you’re basically trying to frost a wedding cake with a fork. It’s not impossible, but you’re definitely making the task an awful lot harder than you needed to.
You need a proper CRO tools in your toolkit that helps you measure, analyze, and act on real data efficiently. The best marketing teams (yes, even teams of one) should at least have these five core tools on hand:
- Landing page builder that lets you create and update pages without begging developers for help every time (hello, freedom!)
- A/B testing tools that make running experiments as easy as clicking a few buttons
- Analytics platforms that reveal how visitors actually behave on your pages (not how you think they behave)
- AI optimization tools that can help you run more efficient A/B tests no matter your traffic volume
- AI copywriting tools that help you test more headlines, CTAs, and messaging faster
Think a few of these are just “nice to haves”? Think again. They’re essential for acting on insights without getting stuck in bottlenecks or burning out your team.
When your competitors can launch and learn from 10 new test variants of a page in the time it takes you to update one headline, who do you think will find the winning version faster?
This is exactly why we’ve been building Unbounce to cover everything you need in one place:
- A drag-and-drop landing page builder
- Built-in A/B testing
- Seamless integrations with Google Analytics (and dozens of other tools)
- Smart Traffic for AI-powered optimization
- Smart Copy to accelerate your content creation
Instead of cobbling together four or five different platforms (and dealing with all the learning curves and subscription fees), you get one streamlined system designed by marketers, for marketers.
SUBSCRIBE
Don’t miss out on the latest industry trends, best practices, and insider tips for your marketing campaigns
Start measuring what matters (and drive more conversions)
Remember how we started? Drowning in data but starving for insights?
Let’s flip that script.
With the right approach to CRO analytics, you can transform from a marketer overwhelmed by numbers to a marketer who knows exactly which levers to pull for better results.
Quick recap of the five steps we’ve covered help you transform raw data into clear actions:
- Define what success actually looks like
- Focus on metrics that move the needle
- Add the crucial “why” behind the numbers
- Build tests based on real insights
- Make continuous improvement your default setting
The difference between companies that consistently improve their conversion rates and those that plateau isn’t budget, talent, or luck. It’s systematic measurement and testing.
Ready to put these principles into practice?
Start a 14-day free trial with Unbounce and see how proper CRO measurement can transform your marketing results.
No more guessing. No more crossed fingers. Just clear insights that lead to confident decisions and better conversion rates. Time to turn those metrics into magic.

Related articles


