Back in October, we were the first to claim that 2019 will be the year of page speed. We’ve got our eyes on the market and lemme tell you: Google is sending serious signals that it’s crunch time to deal with your slow pages.
Faster pages are a strategic marketing priority.
And sure enough, Google has made yet another change to uphold that prediction. In early November, they quietly rolled out the most significant update to a core performance tool we’ve seen to date, announcing the latest version of PageSpeed Insights.
So what does this update mean for marketers and their bottom line?
If you’ve used PageSpeed Insights to test page performance, it’s time to retest! Because your old speed scores don’t matter anymore. The good news is that you’ll have new data at your fingertips to help you speed up in ways that actually matter to your prospects and potential conversions.
Let’s take a closer look at this update and explore why it should play a role in your page speed strategy in 2019.
“You can’t improve what you don’t measure.”
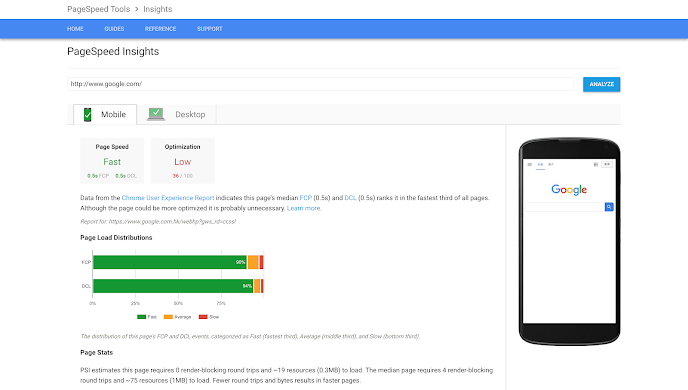
PageSpeed Insights is easily Google’s most popular tool for measuring web performance.
When you look at the screenshot below, you can see why. It provides an easy-to-interpret color-coded scoring system that you don’t need an engineering degree to understand—red is bad, green is good. Your page is either fast, average, or slow. The closer to a perfect 100 you can get, the better. The scores also come with recommendations of what you can do to improve. It’s almost too easy to understand.
Earlier versions of PageSpeed Insights had some issues with how they reported performance. Simple results could be misleading, and experts soon discovered that implementing Google’s suggested optimizations didn’t necessarily line up with a better user experience. You might’ve gotten great scores, sure, but your pages weren’t always any faster or your visitors more engaged. Don’t even get me started on your conversion rates.
As Benjamin Estes over at Moz explains, “there are smarter ways to assess and improve site speed. A perfect score doesn’t guarantee a fast site.” Many experts like Estes began turning to more reliable tools—like GTMetrix, Pingdom, or Google’s own Lighthouse—to run more accurate performance audits. And who would blame them?
The latest version of PageSpeed Insights (v.5) fixes these issues by putting the focus where it should be: on user experience. This is a huge leap forward for marketers because it means that the tool is directly relevant to conversion optimization. It can help you get faster in ways that translate into higher engagement and conversion rates.
For the full scoop, check out Google’s release notes here, but there are really two changes you should note:
1. PageSpeed Insights Now Uses Lighthouse
Lighthouse is excellent because it gives you a more accurate picture of how your landing pages perform with lab and field data. The lab data means you get results ASAP, whether you’ve seen traffic yet or not. This gives you a way to test and improve your pages before you point your ads at them.
An important note is that Lighthouse simulates a page load on a mid-tier device (Moto G4) on a mobile network—roughly equivalent to the fastest 25% of 3G and slowest 25% of 4G. So it’s a pretty solid estimate of what you’re likely to see in the wild. Here’s what it looks like:
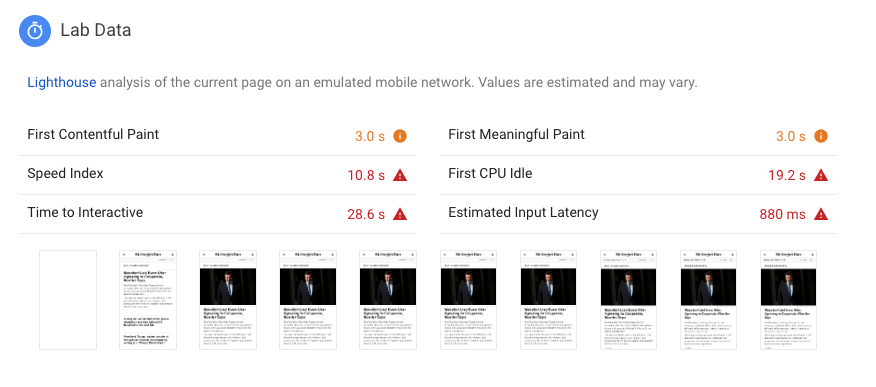
The Lighthouse engine behind PageSpeed Insights also brings more user-centric performance metrics with it, two of which are very important to your landing pages:
- First Meaningful Paint (FMP) is the time it takes for the first valuable piece of content to load—usually a hero shot or video above the fold. It’s the “is this useful?” moment when you catch—or lose—a visitor’s attention. Even if the rest of your page loads later, it’s paramount that the first page elements appear as quickly as possible.
- Time to Interactive (TTI) is the first moment a visitor can interact with your page. It’s the best measure of speed to determine if a visitor will happily engage with your content, or whether they’ll get annoyed and bounce because your landing page keeps choking on clunky JavaScript or poorly prioritized code.
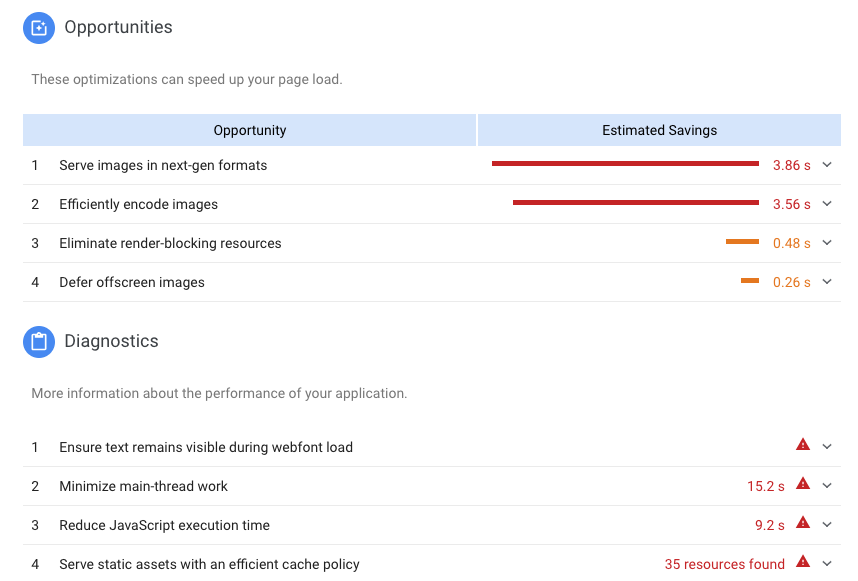
2. PageSpeed Insights Gives You Better Opportunities and Diagnostics
You can bid adieu to the short checklist of optimizations that experts like Ben Estes called out. Google has replaced the (moderately useful) feature with new opportunities and audits that will actually help you improve your visitor experience. These include new suggestions and estimated savings for each.
Your priorities should be much clearer:
How your Unbounce Pages Stack Up
Faster pages earn you more traffic and better engagement. As a result, page speed has a major impact on your conversion rates and can even help you win more ad impressions for less. That’s why we’ve made page speed our priority into 2019.
To show how Unbounce stacks up in the real world, we chose to test an actual page created by one of our customers, Webistry, a digital marketing agency. Their “Tiny Homes of Maine” page is a real-world example.

It has tons of custom functionality, so it’s fairly representative of what many customers do with the Unbounce builder. (The ability to customize is often why customers choose Unbounce in the first place!) This page includes custom Javascript for smooth scrolling, a sticky header, fading header, some custom CSS, and a bunch of images of various file types.
We tested two versions of “Tiny Homes of Maine” using Google PageSpeed Insights v.5, running a minimum of three tests using the median results. The results below focus on the mobile scores:
Speed Boost
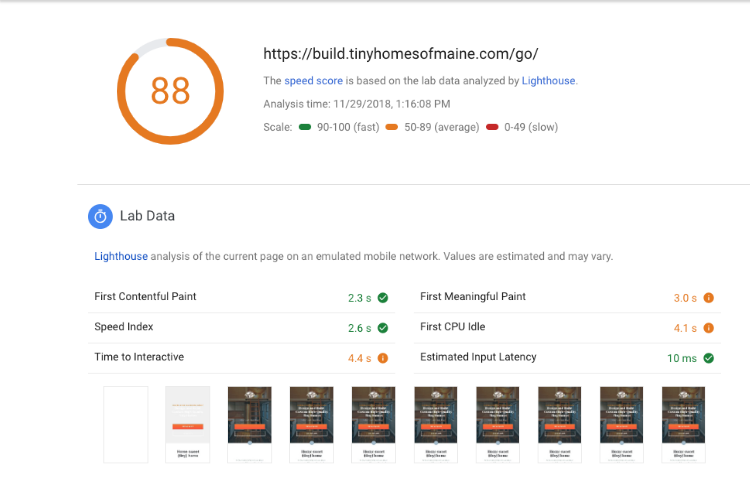
First, we tested the original Tiny Homes of Maine landing page using Unbounce’s Speed Boost, which optimizes landing page delivery to do things like leverage browser caching, prioritize visible content to load first, bundle Javascript, and so on. Speed Boost handles the technical recommendations from PageSpeed Insights that developers usually tackle behind the scenes. You can see the overall results of the test here:
Speed Boost + Auto Image Optimizer
Next, we retested the Tiny Homes of Maine adding our upcoming Auto Image Optimizer into the mix. This new tool automatically optimizes your images as your page is published. You can fine-tune your settings, but we used the defaults here. Check out the mobile results:
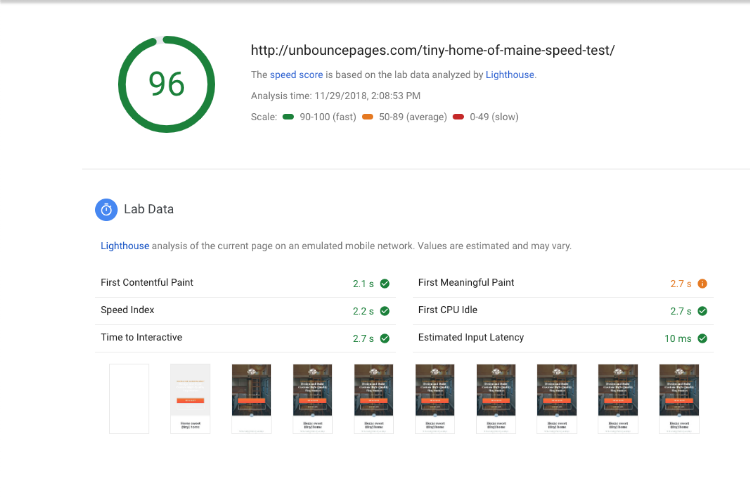
The score jumped from a respectable 88 to an incredible 96 and, more meaningfully, we saw time to interactive improve from 4.4 sec to 2.7 sec. That’s 12.3 seconds faster than the average mobile web page, and 0.3 seconds faster than Google’s ideal 3 second load time.
Here we’ve shared the time to interactive speeds from both tests, for desktop and mobile, measured against the average web page:
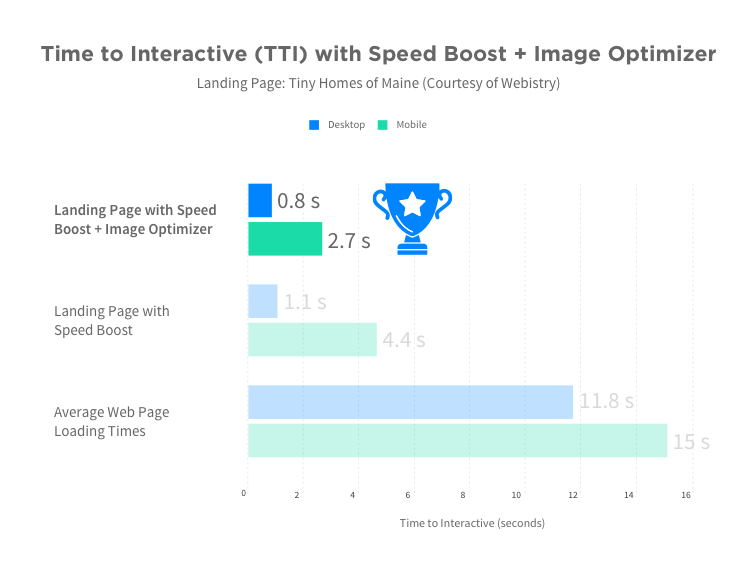
Overall, when we tested, we saw Speed Boost and Auto Image Optimizer create a dramatic difference in performance without sacrificing visual appeal or complexity. We took a compelling page that converts well and upped the ante by serving it at blazing speeds. Whether on a mobile or desktop, the page loads in a way that significantly improves the visitor’s experience.
Page Speed & Your Bottom Line
Seconds are one thing, but dollars are another. Google recognizes the direct impact that fast load times have on your bottom line, which is why they released the Impact Calculator in February 2018. This tool sheds more light on why providing accurate measurements is so important.
Let’s revisit our Tiny Homes landing page above as an example. Imagine this landing page gets 1,000 visitors a month, at a conversion rate of 3.5% (which is just slightly higher than the average Real Estate industry landing page in our Conversion Benchmark Report). If the conversion rate from lead to sale is 5%, and each conversion is worth an average of $54,000 (which is the mid-priced home on their landing page), then their average lead value is $2700.
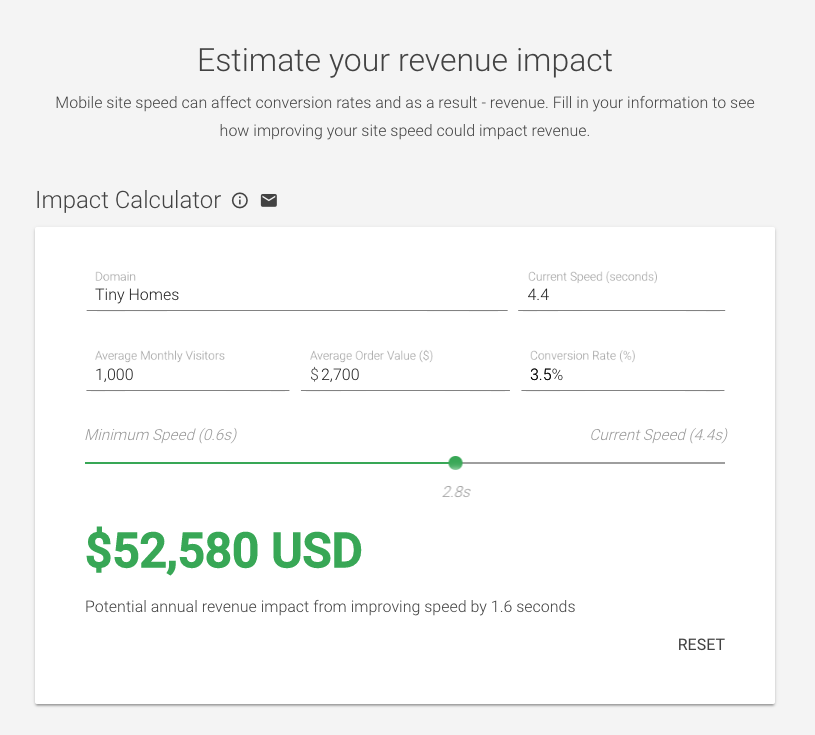
When we input those numbers into the Impact Calculator and improve their mobile page speed from 4.4 seconds to 2.8 seconds, as shown in the test above, the impact to revenue for this one page could be $52,580.
Heck yes, speed matters.
And if we forecast the near-instant speeds promised by Accelerated Mobile Pages (AMP), that page could see a potential annual revenue impact of more than $179,202 USD if it were to load in 1 second.
And that’s one landing page!
If you’ve been struggling with how to improve your page loading times, this latest version of PageSpeed Insights now gives you a much more meaningful picture of how you’re doing—and how to get faster.
You may not have considered speed a strategic priority, but when seconds can equate to tens of thousands of dollars, you need to. Try the Impact Calculator yourself or contact our sales team if you’d like to see what kind of revenue impact Unbounce landing pages can get you.

