There’s no doubt that the social media marketing landscape has changed. Across platforms, organic efforts simply don’t see the cut-through they once did — agh, what’s that noise?
That’s a lot of noise to compete with.
Paid and promoted posts, however, are an effective way to cut through the noise to reach your specific target audience when executed strategically.
But all too often, people dive head-first into paid media without a strategy.
They test several elements at once without a goal in mind. They’re left not knowing what worked and what didn’t. Their managers and teams are then hesitant to try it again (or even try it the first time) because they don’t have a clear picture of the value added or investment returned.
With proper objectives, processes, plans and measurement, however, paid ads on social can add measurable value. They can drive purchases or signups, get eyeballs on your content or allow you to learn more about your target audience — specifically, what resonates with them and what doesn’t.
Below, I’ll walk you through:
- Defining objectives and KPIs for your social media campaign
- Prepping and launching the campaign
- Measuring results
- Reporting on results and iterating for your next campaign
We’ll eliminate any uncertainty around what should be measured and what should be communicated with your team. And you’ll walk away with a step-by-step approach to measuring your campaign effectiveness so you can get your message to the people who need it.
Step 1: Defining your objectives and KPIs
You’re not going to know if your campaign is successful or not if you don’t know what you’re trying to accomplish.
Behind every well-executed paid social campaign are two important elements:
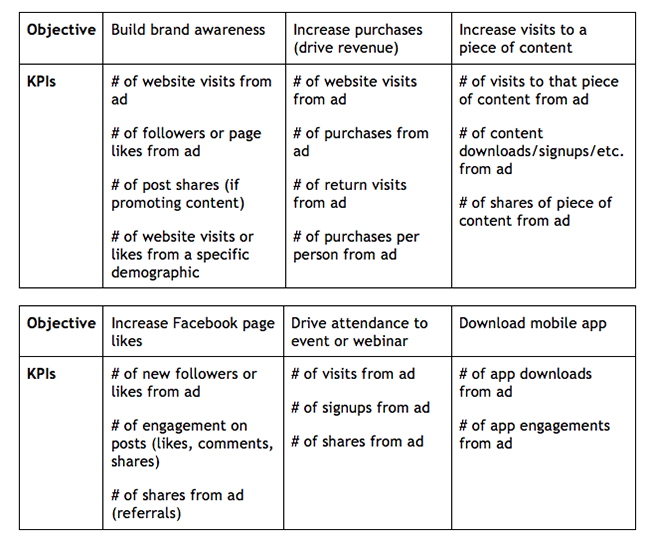
- Clear objectives: i.e.: drive brand awareness, increase product purchases, increase visits to a specific piece of content, increase Facebook page likes, drive event attendance, get more mobile app downloads, etc.
- Key performance indicators (KPIs): hard metrics that tell you if you’re achieving or tracking towards your objective. In short, KPIs tell you if your campaign is performing or not.
Here are the different KPIs you’d use for the different objectives and stages of a paid social campaign:
For every KPI, you’ll also need to establish benchmarks and targets — the baseline numbers you’re starting with so you can measure growth.
Based on your current conversion rate, how many more visitors do you need to hit your revenue target? Or, how many more attendees do you need to meet your ticket goal?
Together, a benchmark and a target provide context around your KPI; they give you something to measure against.
(Running a campaign for the first time and are unsure of an appropriate benchmark? Nanigans have great resources covering this.)
Step 2: Prepping and launching the campaign
Once you’re clear on your goals, you’ve got a heck of a lot of work to do before you can launch.
Every step is a beast of a topic that warrants its own post — so be sure to do your research before you proceed. At a high-level, you’ll want to:
- Define your target audience.
- Plan your ad creative — copy and design that will resonate with that audience. This includes creating snazzy ads and corresponding landing pages that will resonate with them.
- Set up tracking for your landing pages using a UTM code builder. UTM codes are a bit of text added to the end of your URL that tell you where exactly visitors came from (which channel, type of ad, campaign, etc).
- Build out your campaign. Each network has its own super-detailed tutorial (Facebook, Instagram, Twitter).
")
Step 3: Measuring results
You can check on the results of your campaign in several places.
Google Analytics
In order to know what exactly a visitor is doing after they click the link you’re promoting, you’ll want to track your ad through Google Analytics. This way you can measure more than just post clicks and engagements (likes, comments, shares).
Google Analytics allows you to track conversions from your ads and see what other pages they visited, where they bounced and more. This intel will help you determine whether or not you targeted the right audience with your ad.
The UTM codes you set up in step two help you check Google Analytics for which networks are bringing you the most traffic.
After your ad is running, Google Analytics will tell you how many visitors came from which ad if you click on Acquisition → All Traffic → Sources/Medium:
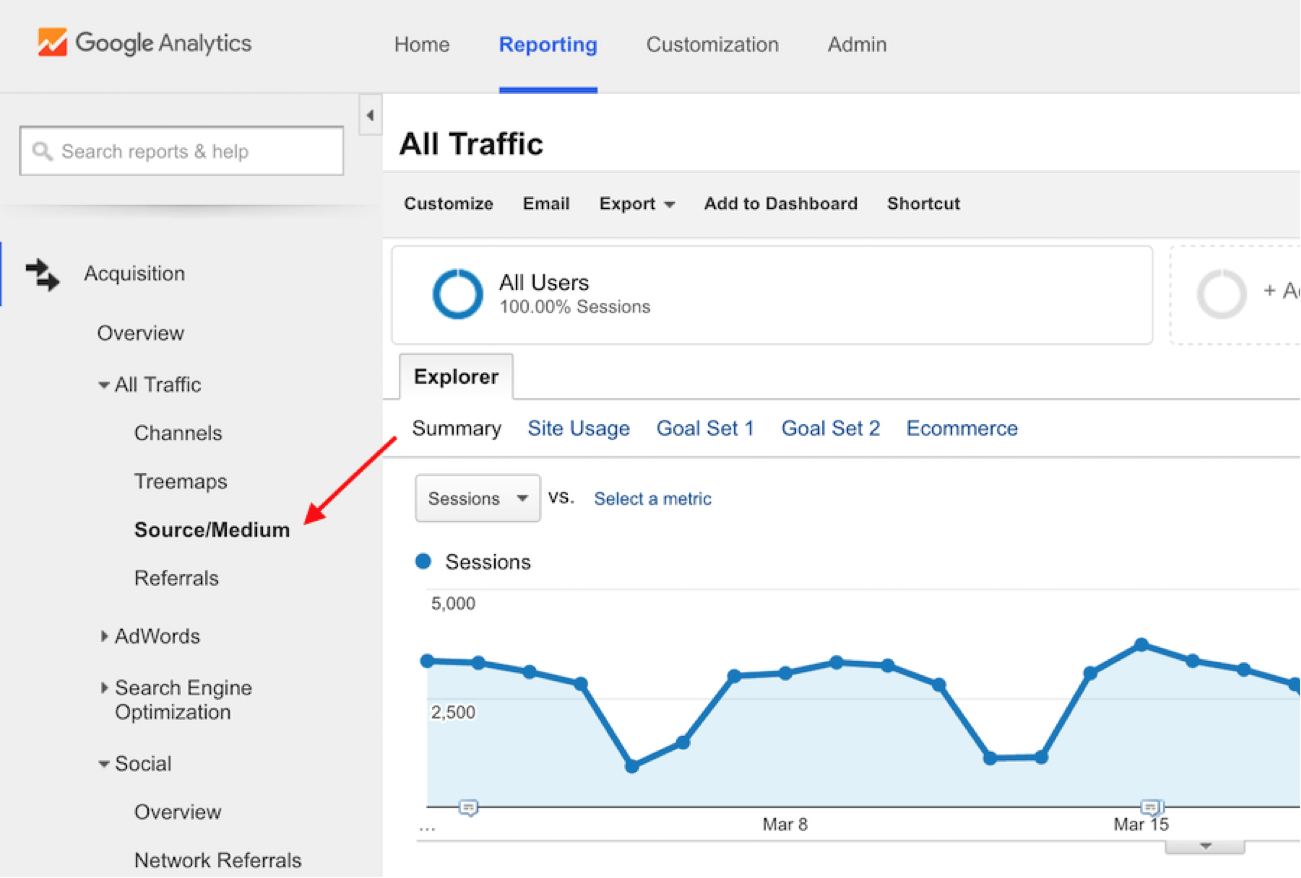
It will look something like this:
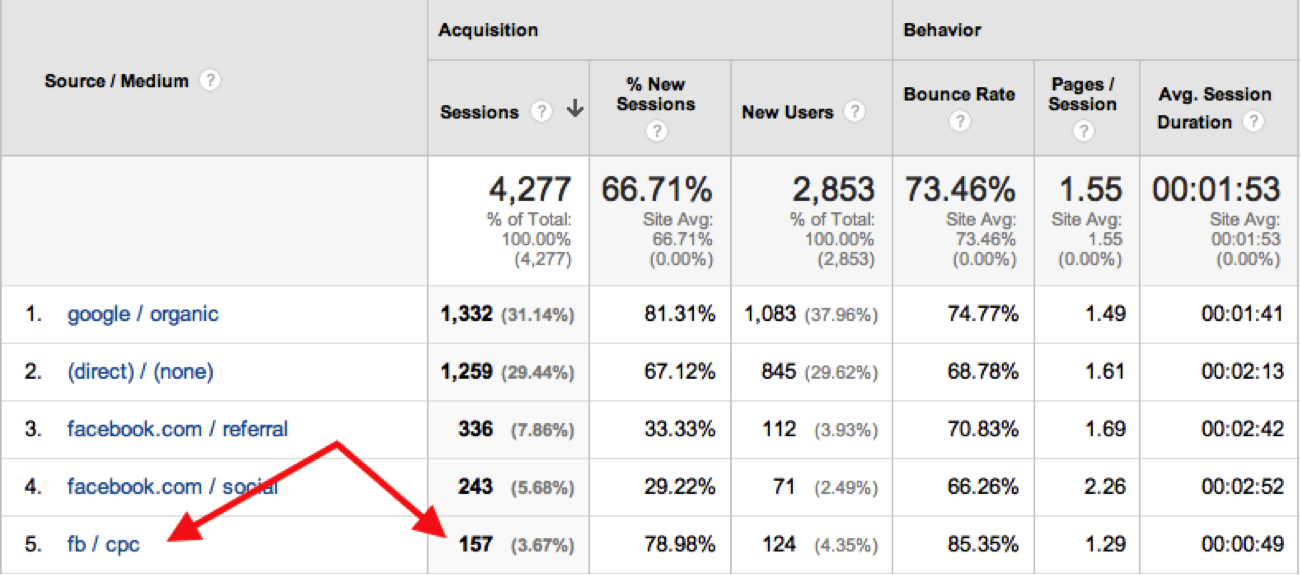
While this will come in handy when seeing which social media network is performing well for you, it can also be valuable for testing which creative is converting best (if you create a separate campaign/UTM code for each set of creatives).
When A/B testing, just remember to keep your KPIs in mind. Is your test bringing you closer to the results you set out to get?
Social media dashboards
Google Analytics is effective for tracking conversions and the visitor journey, but it won’t tell you what type of impact your ad had on social media in terms of engagement and awareness.
Social media ad dashboards tell a different part of the story around how your ad is performing. They will tell you how your campaign has impacted your brand awareness on social. Use social media ad dashboards to track followers, likes, shares, comments and clicks within your ad.
To illustrate, let’s look at an example of a promoted post that appeared in readers’ Facebook newsfeeds.
To track the performance of your ad, you’d visit your Facebook Ads Manager. Here, you’ll find all of your campaigns laid out with results, reach, cost and amount spent.
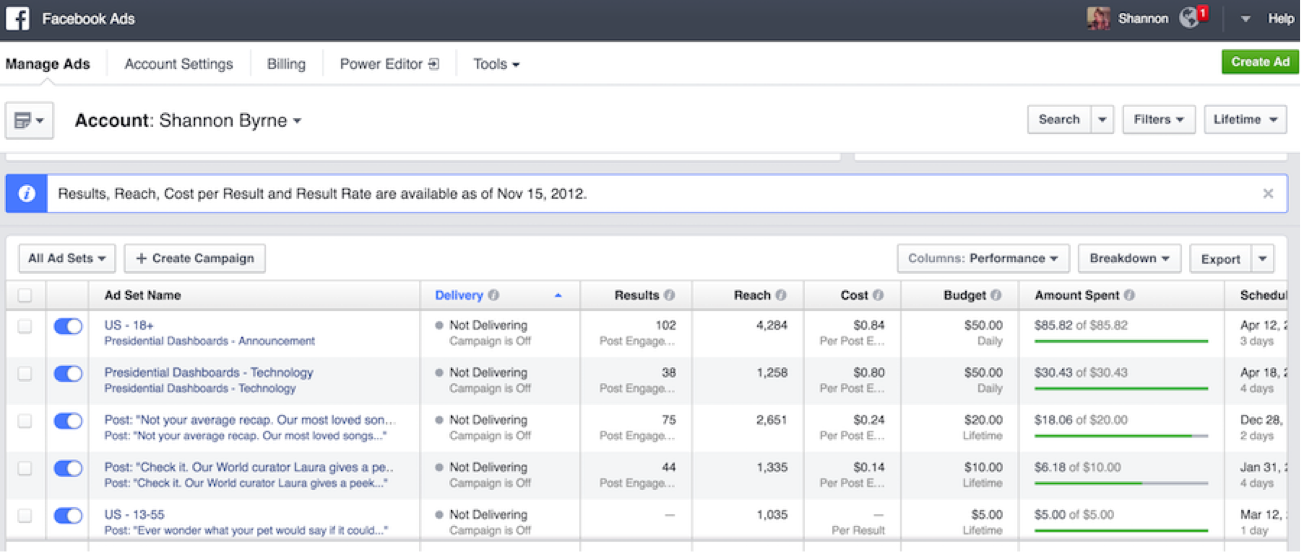
To dive deeper, click on each campaign name for detailed results.
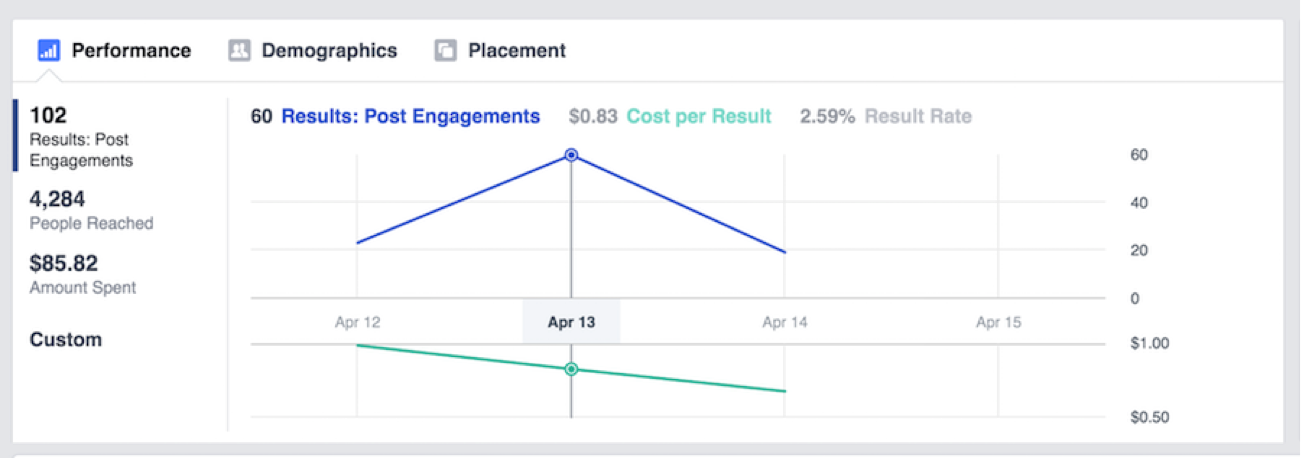
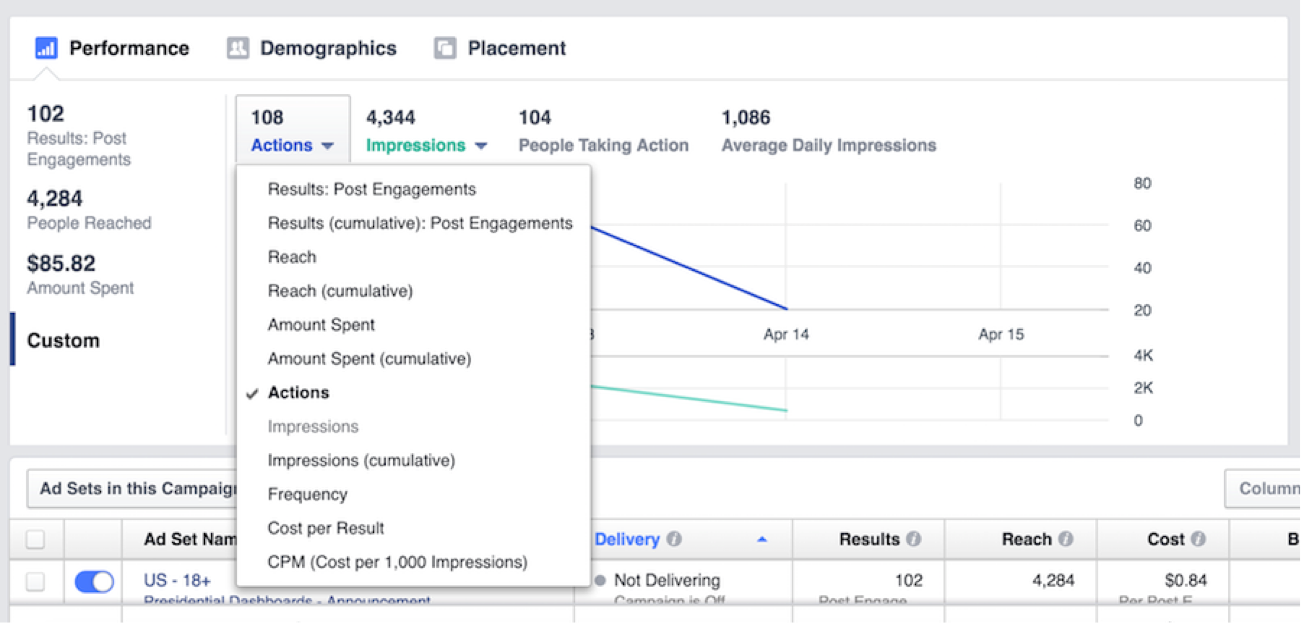
In the Performance tab, you can also click “Custom” to drill down and look at specific results by action, reach, impressions and cost per result. In this example, we’re looking at Actions, which are measured by engagements – specifically, likes, clicks, shares and comments.
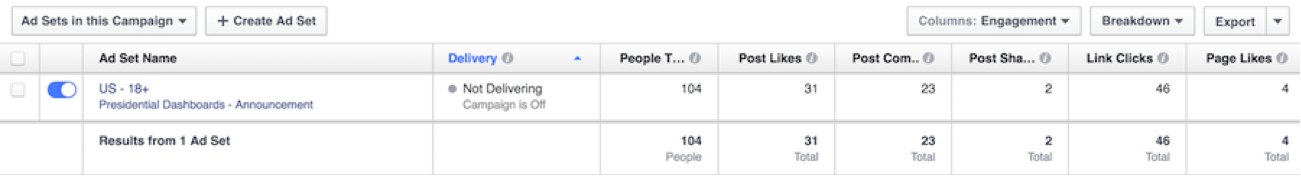
To see how viewers are specifically engaging with your ad, scroll down past the graph. In the table, in the Columns drop down, select “Engagement.”
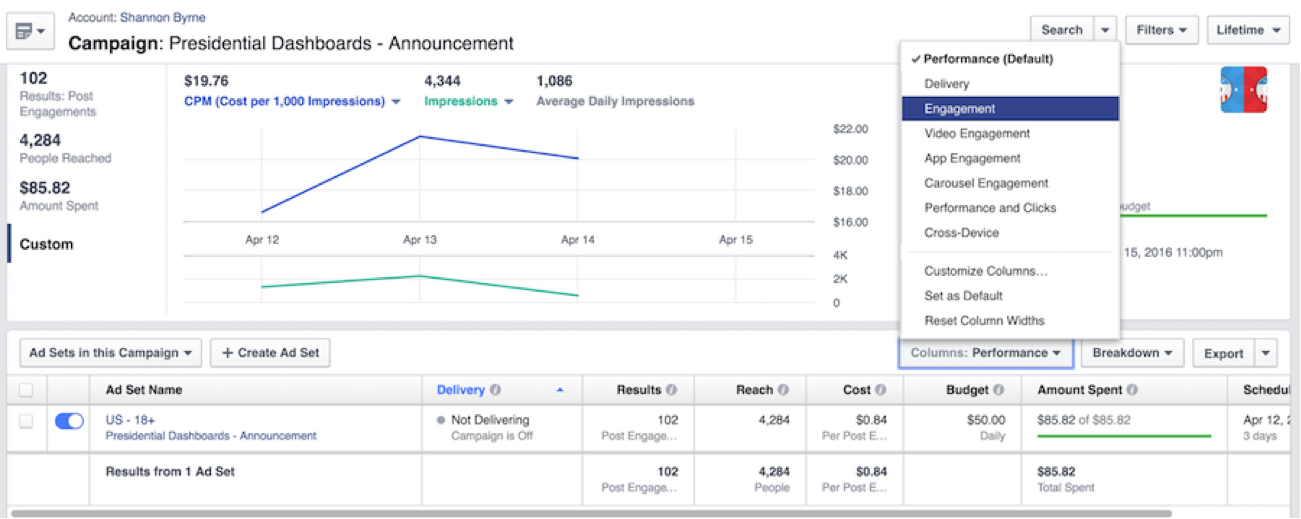
Here’s you’ll find post likes, comments, shares, link clicks and page likes from the promoted post.
When you do this, you lower your cost per click because the piece has already proven to be of interest to your audience. Essentially, if content performs well organically, the social network knows it’s good content. More clicks = less cost.
A broader view of all networks
So Google Analytics tells one part of your ad’s story, and social media dashboards tell another. How do you get them all together to paint one holistic and simple picture for yourself and your team?
One solution is to create a live paid social campaign dashboard. (Disclaimer: I’m from Geckoboard and we provide a tool to build dashboards. Other dashboarding tools are available!)
A dashboard provides a broad view of your ads’ key performance indicators. It’s also something digestible to share with stakeholders at a glance without having to bog them down with Excel data — or complicated reports from GA and social platforms they might not even have access to.
A dashboard tracking ad campaign success might look something like this:
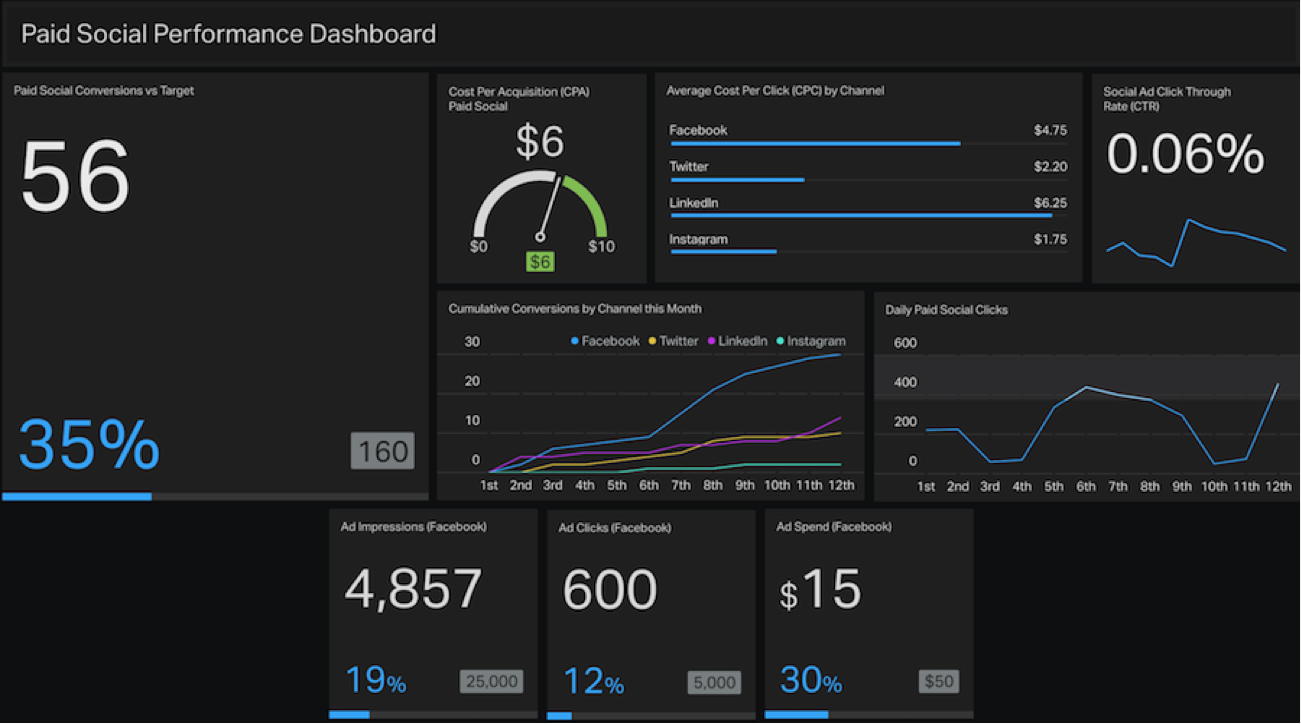
Rather than focusing on one channel, the dashboard above is tracking snapshots of KPIs in an at-a-glance format across all paid campaigns, illustrating how they compare to each other and which is performing best.
Unpacking this a bit:
- In the far left you see the most important stat: number of conversions vs. your target conversions (being signups, purchases, registrations – whatever a conversion means for you). In this example, at 56, we’ve reached 35% of our goal of 160 conversions.
- Moving right, you’ll find how much you’re paying for each acquisition through your paid social efforts.
- Below that is a line graph indicating how much paid ads on each channel are converting. In this example, Facebook is performing much better than the other channels in terms of volume.
- The three KPIs being measured in the last row show you at-a-glance what we walked through in the Facebook Ads Manager above: your campaign’s impact on engagement and awareness.
What kind of insight does this sort of high-level view bring?
Comparing these two graphs (line and bar), it’s clear that LinkedIn is costing more, and you need to either optimize the CPC down by adjusting the audiences you’re targeting or pull back the spend based on the volume of conversions. It may also be worth looking to see if you could increase the volume of conversions on Twitter and Instagram by increasing your CPC bid, given they’re significantly lower than the other two channels.
Step 4: Reporting on the results and iterating
The final step in your paid social campaign is to share the data with your team. You’ll get more ideas and discover new insights as you discuss the campaign results together.
Ideally, the dashboard you’ve built has been front and center in your office or available to your team members no matter where they are (and what they do). You never know, a team member from a different department may have a great idea for a KPI, goal or creative of your ad.
So then, are you ready to start running and measuring your first social media campaign?
To get started, check out the tools Facebook offers for creating ads. Have any questions? Leave them in the comments below – I’d be happy to help!
