
If I had a dollar for every time I’ve been told how important social media is, I’d be off vacationing in Bora Bora right now. My frustration with the “social media pitch” is that people are making very strong claims without backing them up.
What smart marketers want to know is, how do I quantitatively measure my efforts on social media?
In today’s post, we’ll be covering which KPIs (Key Performance Indicators) to track for various social media marketing channels including Facebook, Twitter and Google+. Also included are some handy tools that can help make the process both easy and effective. If you’re just starting to crack down on social analytics, then this post is for you. Let’s get started!
Twitter currently boasts more than 550 million active users. Of these half a billion users, 67% of them are more likely to buy from brands they follow than from brands they do not.
I don’t know about you, but that statistic never fails to blow my mind. Twitter has the ability to drive traffic to your site and drive conversions. Hear that sound? That’s the sound of money in the bank.
If you’re not sure how to set realistic social media goals, I recommend checking out how your competitors are performing. The following KPIs can help you stay on track and comparing them to your competitors’ stats can give you a sense of what exactly “on track” means. I use Rival IQ (yes, this is a shameless plug) when doing any type of competitor analysis on social media.
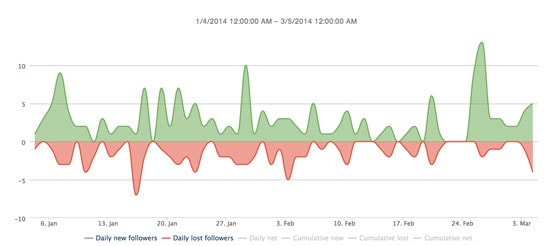
Follower Growth
This is the change in the number of people following your company over time. The larger your reach, the more traffic you can drive to your site. It’s as simple as that. Followerwonk has a great feature that allows you to track follows and unfollows.
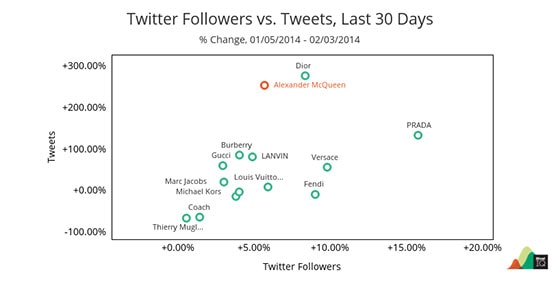
Frequency
How often are you tweeting? Keep track of how often you tweet in a set time period and compare this with your follower growth. Is there a correlation between the two? If so, make the appropriate changes so you can continue to grow your following. While plenty of blog posts suggest an ideal frequency of tweets, I strongly believe that there isn’t a “one size fits all” tweeting plan. It’s all about experimenting and testing which frequency works best for your followers.
Engagement
While a huge following is great, if people don’t engage with your brand there’s not much to brag about. Low levels of engagement mean you aren’t making an impression on your followers. In my eyes, that’s the biggest failure of all. Below are some ways you can measure how engaging you are on Twitter:
@Replies:How often tweets are sent that begin with your company’s handle? It’s important to note that people will only see others’ @replies in their timeline if they follow both the sender and the recipient.

@Mentions: How often tweets are sent that include your company’s handle inside the tweet, not at the beginning. People are able to see all @mentions posted by someone they follow; they do not have to follow both the sender and the recipient. For this reason, I find @mentions to be more valuable than @replies.
Retweets: When someone favorites your tweet, they are essentially just giving you a “thumbs up.” While favorites are nice positive reinforcement, retweets are far more valuable. It’s a good idea to brainstorm how you can convert your loyal “favoriters” to loyal “retweeters.” Here are a few tips and tricks that can help promote retweeting:
- Include retweetable words (ex: “please,” “retweet,” “10,” “You”)
- Don’t be afraid to ask people to “please retweet”, it increases the chance of retweeting by 160%!
- Tweet interesting links (56.69% of all retweets contain a link!)
- Limit your tweets to 80-110 characters. This makes it easier for others to retweet your content and leaves room for them to customize.
- Tweet during times when the majority of your followers are online. You can find this out using a tool like Followerwonk.
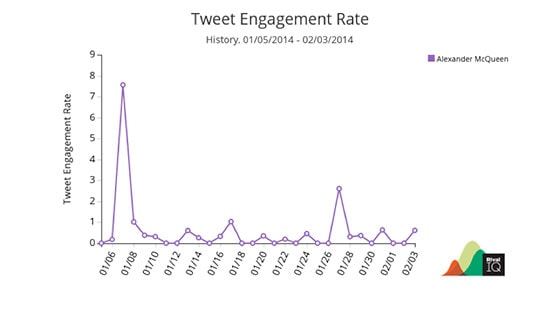
Tweet Engagement Rate: The tweet engagement rate is the number of retweets and favorites a tweet receives per thousand followers. When someone retweets your content, they are sharing your original tweet with all of their followers.
Content Type
Keep a record of the type of content you tweet (pictures, links, etc) – even if it’s as basic as creating an Excel spreadsheet that includes your tweet, content type, and number of retweets and favorites. Is there a particular type of content that receives the most engagement?
Based on your findings, tailor your content to reflect what you’ve found resonates the most with your followers. While there are tools on the web that can track content type, you can also use a simple spreadsheet to keep track of your content and engagement.
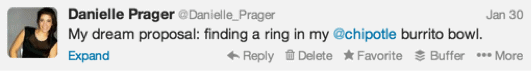
Brand Mentions
In order to see how much your brand is “buzzing” in the Twitterverse, set up a twitter list that tracks your brand’s name. Sprout Social has a monitoring feature that allows you to easily discover what people are saying about your brand.
By carefully monitoring brand mentions, you gain insights into where you’re doing well, where you can improve and who your customer base is.
More importantly, being in the loop gives you the opportunity to grow your brand’s glowing reputation. Just be sure that you always respond appropriately to mentions, even if it’s a simple Thanks for sharing!” Let people know you’re listening; it’s the ultimate sign of good customer service.
Unlike Twitter, Facebook provides their users with a sophisticated set of analytics that can be found through Facebook Insights (only available to brand pages).
With the abundance of metrics that Facebook Insights offers, determining what you should be tracking can be challenging. I find that the most effective approach is to understand and focus my attention on select metrics that I have identified as the most important for my company’s goals on social media.
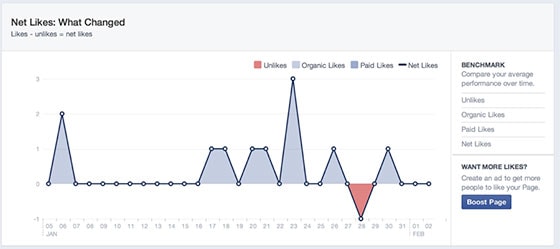
Page Like Growth
Just like we discussed for Twitter, more followers means more reach.
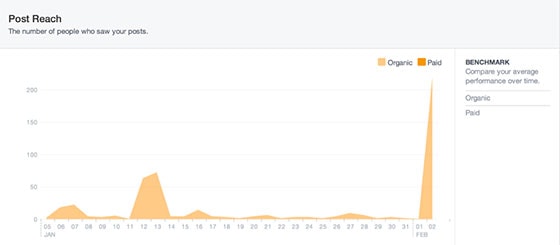
Reach
Reach is simply the number of people who saw your post. This metric is particularly important if you’re experimenting with paid advertising. If you’re spending money on advertising, you want to make sure your investment is paying off. Once you’ve figured out your reach, I suggest checking out HubSpot’s Simple Guide to Measuring Facebook Ad ROI to determine whether or not spending money on Facebook ads is a worthwhile expense for your company.
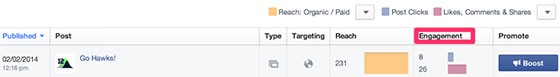
Engagement
Facebook’s algorithm, EdgeRank, places an enormous importance on engagement. In a nutshell, if you want your company updates to show up in your followers’ newsfeeds, your followers need to be liking, commenting on, and sharing your posts.
Measuring post clicks, likes, comments and shares will give you a comprehensive idea of how engaging your fans find you.The measurement of engagement that I care about the most is shares. Similar to retweets, if followers share your content, your reach increases.
Keep in mind that the more you increase your reach, the more opportunity you have to fill the top of the funnel and impact the bottom line!
If your engagement numbers are growing at a steady pace, it’s a good indication that your content strategy is paying off. If your engagement numbers are stagnant or dwindling, it may be time to go back to the drawing board and revisit the type of content you plan on posting in the future.
Here are some helpful Facebook engagement stats, courtesy of Mashable, for those of us on a journey to a more engaging Facebook page:
- Emoticons increase comments by 33%
- A post that includes a question increases comments by 100%
- A post that includes a photo gets 39% more interaction
- Posts that ask followers to “like” or “share” increase the interaction rate by 48%
Google+
With more than 540 million active monthly users, Google+ is definitely not a channel to ignore. Unfortunately, Google has made it very difficult to track a lot of useful statistics, and their API keeps third-party apps from reporting on many of these stats as well.
However, there are ways to MacGyver your way to many useful KPIs. It just takes some time and patience.
Follower Growth
It’s important to keep track of how much your follower base is growing on any social media, Google+ included. Tools like SproutSocal and Buffer for Business allow you to track your +1’s, comments, and shares.
+Name Mentions
Plus mentions are a great way to keep track of who is talking about your brand and what people have to say about it. They may be sharing a piece of content you wrote, giving a new product update their seal of approval, or complaining about your customer service (hopefully not!).
Either way, it’s important to stay on top of what is being said. The only to access your plus mentions that I’m aware of is through your Google Plus Dashboard.
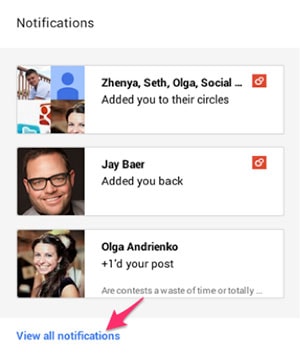
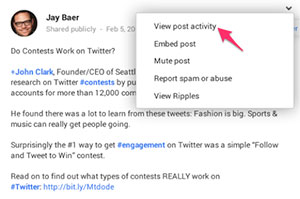
Once you’ve accessed your dashboard, go to the notifications section and click on “View all notifications.”
You will then be directed to a page with a menu at the top that includes “all posts,” “your posts,” “other people’s posts” and “mentions of you.”
If you select the “mentions of you” option, you will be shown the Google+ posts that include plus mentions of your company. Sadly, if you want to track the actual numbers of plus mentions in a time period, you will have to manually count them.
+1’s, Comments, and Shares
Keeping a close eye on the interaction each of your posts spurs can give you insight into what kind of content excites your readers. The type of content that promotes engagement on Facebook may not have the same effect on your Google+ followers.
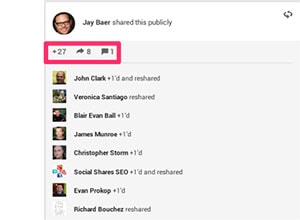
Experimenting with the type of content you post and using engagement metrics as a form of feedback is a foolproof approach to improving your strategy. The easiest way to see how many +1’s, comments, and shares a post receives is to view the post in question and its post activity.
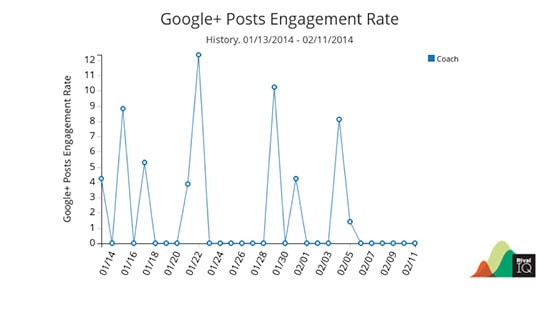
Post Engagement Rate
Similar to tweet engagement rate, post engagement rate measures the total number of +1s, comments, and shares of posts during a set time period. This is a combined measurement of all posts so the change in numbers over time will give you a good idea of whether or not your engagement efforts are paying off.
Feeding the Funnel:
I have two goals when using social media:
- Humanize our brand
- Fill the top of the funnel
The first part is easy. The second is where things get a little bit challenging. Measuring how many qualified leads you are sending into the funnel can help identify whether or not your efforts are paying off.
You can find out how much site traffic was a social media referral by using Google Analytics and looking under “referral sources” for your company website. To fully determine if you’re impacting your bottom line, set up a KISSmetrics custom funnel report to track how many of your social media referrals convert to signup.
It’s pretty safe to say that the majority of marketers are on the same page when it comes to social media. There is no denying its place under the marketing umbrella. While an active presence on social is the obvious first step for your company, it’s important to take a second step and quantitatively measure your efforts.
Use the data to determine your strengths and weaknesses and focus your efforts on what you know has worked in the past. If you plan on trying a new approach, be sure to track whether or not these changes drive more qualified leads into the funnel.
Combining Rival IQ, Google Analytics, KISSmetrics, and Facebook Insights is my formula for keeping close tabs on social media performance.
If you take one thing away from this post, make it this: It’s all about working smart, not blind!
Do you have any KPIs that you feel I’ve left out? I’d love to hear your thoughts in the comments below!
(Image Credit: Tape Measure designed by Daniel Garrett Hickey via The Noun Project)
