Understanding what statistical significance is and why it matters is key for getting the most out of your CRO efforts—but diving into the deep end of statistical analysis can quickly become overwhelming.
To help you better understand the role of statistical significance, probability, and how it all relates to your marketing tactics, we’ve put together this article.
You’ll learn:
- What statistical significance is
- Why it matters for your A/B tests
- How to calculate statistical significance
- Examples and ideas to help you get started
What is statistical significance?
In simple terms, statistical significance means that a test’s results are unlikely to be the result of chance or random occurrence.
Basically, your testing efforts have found a genuine, observable result—even if it isn’t the result you were hoping for. If we wanted to get more technical, though, then statistical significance is a measure of the probability that your test’s null hypothesis is true.
“Hang on, though, what’s a null hypothesis?”
A null hypothesis is a sort of counter-hypothesis designed to keep your tests as objective as possible. A null hypothesis doesn’t require as much careful thought as your test’s hypothesis—it simply says that your test’s results are not correlated to your activities until you can actually prove it.
In other words, a null hypothesis says that a test’s results are caused by pure, random chance.
Still with us?
We get it—that’s a ton of new terminology and jargon to wrap your head around. If you’re still scratching your head about it, it might help to contextualize statistical significance and its related terms in a familiar CRO setting.
Here’s a simple example:
Imagine you’re running an A/B test with two landing page variants.
Your hypothesis for your test is this:
“By changing the headline on my hero variant, I predict we’ll see a 5% increase in the page’s conversion rate, compared to the control variant.”
For this example, your null hypothesis could be something as simple as this:
“The changes made to the hero variant won’t have a measurable effect on the conversion rate, so any results we see can be attributed to random chance.”
As ridiculous as it might seem to say out loud or even put into words, a null hypothesis is nonetheless a necessary guardrail when you’re trying to determine statistical significance—even if you don’t believe what you’re saying.
TABLE OF CONTENTS
Josh Gallant
Josh is the founder of Backstage SEO, an organic growth firm that helps SaaS companies capture demand. He’s a self-proclaimed spreadsheet nerd by day, volunteer soccer coach on weekends, and wannabe fantasy football expert every fall.
» More blog posts by
Josh Gallant
What is p-value in statistical significance?
Statistical significance and null hypothesis aren’t the only important terms you need to know. If you’ve skimmed anything about these topics, then you’ve probably also seen some mention of “p-value.”
P-value is simply a way of expressing statistical significance, and may also be referred to as a “confidence interval.”
Formally, p-value is a statistical measurement used to validate a hypothesis against observed data, and it helps determine the probability that observed findings are the result of random chance. Generally:
- The higher a p-value, the more likely it is that your results are due to chance.
- The lower a p-value, the more confident you can be that your results are statistically significant.
While the exact figure may vary, it’s recommended that most tests aim for a p-value of 5% or less to increase confidence that your data is reliable.
Why is it important for your A/B tests to be statistically significant?
So now we’re getting into the meat and potatoes: Why is it important that your A/B tests be statistically significant?
There are four major reasons why you would want your tests to be statistically significant:
- To validate your hypothesis
- To ensure informed decision-making
- To reduce uncertainty
- To help you uncover further findings
Let’s take a closer look at each of these reasons.
Validating hypotheses
The most apparent reason for ensuring statistical significance is that it helps you validate the hypothesis you’re testing. Whether that hypothesis is correct or not is less important; statistical significance simply means the tests and data you’re gathering are valid and worth analyzing.
Informing decision making
Statistically significant data helps you make a strong basis for any decision making you undertake. Because you know that your data is reliable, you can be more confident in using it to guide and shape your strategy.
Reducing uncertainty
This one is closely related to your decision-making efforts, but bears repeating here—by determining your data is statistically significant, you’re reducing uncertainty and ambiguity in your testing and CRO processes. Having a strong foundation of good, reliable data is critical, as it gives you precedents you can point to and something you can rely on to explain your reasoning and put any doubts to rest.
Guiding further findings
Finally, statistically significant data is vital for helping you figure out next steps. This is a foundational part of your CRO efforts—we’ve written before about how even those A/B tests that don’t confirm your hypothesis shouldn’t be considered failures.
As long as you’re still gathering statistically significant data, you can learn from it and use it to formulate new hypotheses and discover new information.
How to calculate statistical significance
Now that we’ve covered all the background details and the reasons why statistical significance is important, let’s dig into how you can go about calculating statistical significance in your next CRO experiment’s findings.
Calculating statistical significance can be an extensive process if you’re just running the numbers by hand—thankfully, tools like Unbounce’s A/B testing tool help automate these processes so you’re not crunching the numbers yourself. But knowing how to make the calculations yourself and understanding exactly what you’re calculating can help you develop a better understanding to inform further testing.
Generally speaking, calculating statistical significance involves:
- Create a hypothesis
- Determine the significance level
- Calculate ideal sample size
- Collect data
- Analyze data
- Interpret results
1. Create a hypothesis
No matter what test you’re running, you’re going to need a hypothesis and a null hypothesis. Your hypothesis is just the typical sort of hypothesis you’d typically develop for any CRO experiment you run—and you probably already have some idea about what you’re looking to accomplish.
To get a bit more technical, your hypothesis should specifically be a clear statement that predicts a potential outcome following a change to a single variable, like we’ve written about before.
And remember, for A/B testing, you’re only changing one variable at a time.
Alongside your standard hypothesis, you’ll need a null hypothesis to help with your calculations. Like we mentioned earlier, your null hypothesis simply says there’s no significant difference between groups you’re comparing.
2. Determine a significance level
Next, you’ve got to determine the significance level. The significance level is a sort of threshold for the strength of evidence in your A/B test that must be gathered before you can reject your null hypothesis.
Basically, it’s the level of probability or risk that your results are due to chance—the other side of your test’s p-value. The significance level is sometimes referred to as the alpha.
In most cases, you’ll determine a significance level between 0.01 or 0.05, or 1-5%. This is a pretty common range for most significance levels. Remember, the lower the significance level, the stronger your evidence needs to be.
3. Calculate ideal sample size
As part of your efforts to determine statistical significance, you need to ensure you have the right sample size.
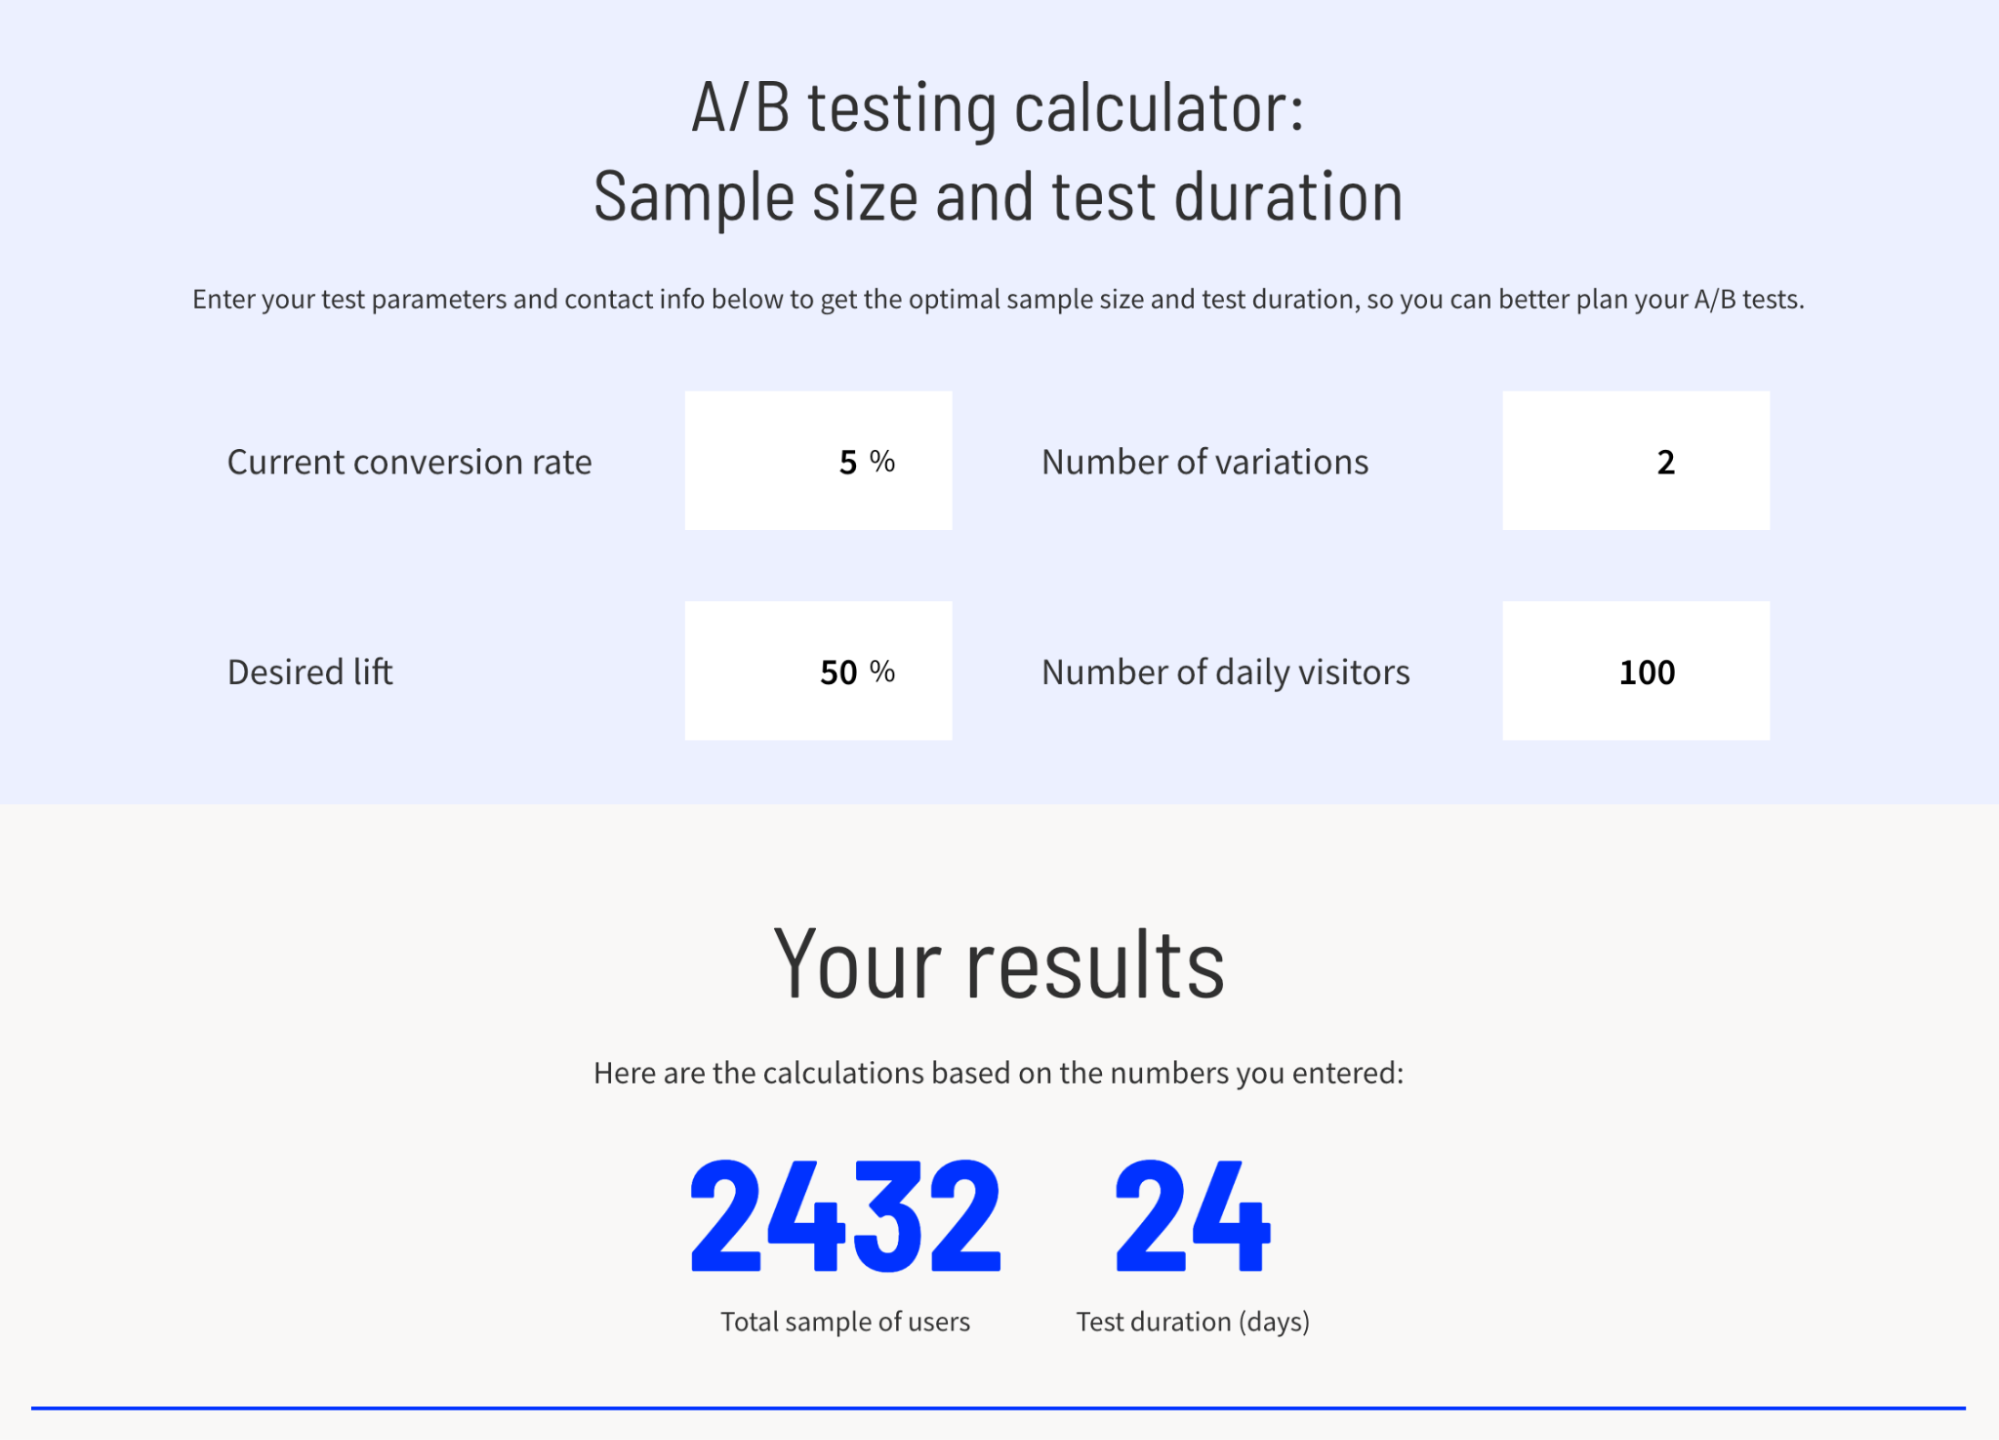
This can be a tricky process. Your best bet for figuring out the ideal sample size for your test is using Unbounce’s A/B Test Duration and Sample Size calculator—this will let you quickly punch in your goals and get useful target numbers to determine how long your test should run and how large your audience should be.
There are a number of variables involved in calculating sample size, so using a calculator is the easiest way to streamline what can otherwise be a convoluted process.
This is also a great opportunity to determine standard deviation (how varied the data is above the mean or expected data) and standard error (the standard deviation of the sample population).
Here’s the formula for calculating standard deviation:
Standard deviation = √((∑|x−μ|^ 2) / (N-1))
- √ indicates we’re taking the square root
- Σ represents the sum of the data
- x represents individual data
- μ represents the data’s mean for each group
- N represents the total sample
And the formula for calculating standard error:
Standard error = √((s1/N1) (s2/N2))
In this equation, the variables are as follows:
- √ indicates we’re taking the square root
- s1 represents the standard deviation of your first group
- N1 represents group one’s sample size
- s2 represents the standard deviation of your second group
- N2 represents group two’s sample size
4. Collect data
Next, you run your A/B test and gather your data. We’ve written a ton on the ins and outs of A/B testing elsewhere, so we won’t go into too much detail here. Just make sure any analytics tools you’re running are set up properly and that you’re sending your audience to the appropriate variants.
Make sure you’re collecting data from a random sample to avoid any bias that could influence your test’s results. Let the test run and get your data in order.
5. Analyze data
This is probably the most complex part of calculating statistical significance, and it’s going to be pretty heavy on the math.
There are a few ways to run a statistical analysis of your data, including:
This is a statistical test that can be used to determine if there is a significant association between two categorical variables. These tests can help you see if the results you observe are different from what you’d expect by chance, as in your null hypothesis.
Chi-square tests are one of the most reliable ways to analyze your A/B testing data. These are discrete tests that only generate a limited number of results, which helps focus your testing efforts and lets you draw more accurate conclusions.
These tests are used to determine if there’s a significant difference between the means of two groups when the sample size is large and the population variance is known. It’s often used for comparing proportions or means.
T-tests are similar to Z-tests, but are used when you’re dealing with a small sample size or an unknown population variance. These tests compare the means of two different groups to see if there are any significant differences.
ANOVA tests are used to compare the means of three or more groups to figure out if at least one group’s mean is notably different from the others. These tests are helpful if you’re comparing multiple groups at the same time, like in a multivariate test or A/B/n test (where the ‘n’ just means more than two variants).
6. Interpret results
Finally, you can interpret your data. This is the meat and potatoes of any A/B test, where you put your findings under the microscope and figure out what it’s trying to tell you.
If your results come back within that threshold, congratulations! Your test results are statistically significant and you can now start to use them to determine what actions you want to take on your landing pages.
You’ll also need to calculate the p-value. This is most often done via statistical software or referring to probability tables, and it’s important to remember that how you calculate your p-value will depend on the type of test you’ve run in the first place.
Once you have your p-value, you need to compare it to your previously established significance level.
Remember how we mentioned that, for most tests, you’d set your significance level between 0.01 and 0.05? If your p-value sits within that threshold of 1 to 5%, then you can safely assume your results are statistically significant.
But if your p-value is above the threshold you’ve set, then you can’t be certain your tests are generating reliable, valid data—which means you may need to run the test again or revise your testing parameters.
Statistical significance example
So we’ve covered a ton of information here, and statistics can be a bit daunting to try and tackle on your own. Here’s a simple example to put things in perspective.
Say you’re testing two versions of a CTA button on your landing page. You’ve settled on “buy now” as your button text but you want to see what design elements will help you drive conversions.
You make one variant page with a red button design (variant A) and one with a green button design (variant B). You A/B test your elements and get the following results:
- Variant A had 1,000 visitors and 100 of them converted—a 10% conversion rate.
- Variant B had 1,000 visitors, but 120 of them converted—a 12% conversion rate.
At first glance, you might think variant B is the clear winner and that you should be making similar updates across ALL your landing pages, right?
These results might not be statistically significant—so you start analyzing the data more closely.
You start by calculating the difference in conversion rates—easy, 2%. You need to compare this variance to the standard variation you’d expect when comparing two groups. You run your statistical test, and determine that the probability of seeing a 2% difference is very low, coming in under 5%.
Because this p-value is below the significance level for your test, you’re confident that the results you achieved aren’t simply a stroke of good luck and that the green button on variant B is the cause of the higher conversion rate.