As an Unbounce blog reader, you already know conversion rate optimization is a great way to drive more results from the money you’re already spending to acquire traffic to your site. So today I’d like to focus on another way to make more money from your marketing efforts; namely, ad optimization.
After a decade of building AdWords at Google, I cofounded Optmyzr because I found it was too time consuming to run best practice optimizations. And — considering that last year over $35 billion was spent advertising on Google (more than twice what was spent on Facebook) — there is tremendous value in making AdWords perform even a little bit better.
While there are many ways to improve your ad performance, one of the most pertinent is to improve your Quality Score (QS), particularly the subcomponent, landing page quality (LPQ).
But before I get into how to improve your Quality Score via landing pages, here’s some behind-the-scenes context based on my time at Google.
What is Google Quality Score?
One of the teams I worked on for seven years while at Google was the Quality Score team so I’ve written extensively on the topic. For a primer, here are some of my favorites:
- Quality Score Explained by a Former Googler
- Quality Score: All You Need to Know
- Calculating Quality Scores (Video)
Ultimately, Quality Score is Google’s way of using collective wisdom of many searchers to measure the relevance of a keyword. In short, it’s a measure of how good of a job you’re doing providing people with search queries with strong answers.
This is important because if you are the best answer to someone’s query with your ad and resulting landing page, Google gives you your clicks for less money because you’re helping provide a better user experience, which makes Google more money.
Quality Score impacts ad rank and costs
It’s fairly well known that Quality Score is one of the factors that determines Ad Rank. The other factors are the bid and the impact of ad extensions.
When you improve any of these three components, your Ad Rank increases, which leads to one of two possible outcomes:
- You win a better ad position (but pay the same or more for improved placement on the page), or
- The position of your ad remains the same, but you get a discount and pay less for any clicks you get.
In short: You can get a discount on AdWords by making your ads (and corresponding landing pages) more relevant!
This is because the CPC you pay is only part of what determines how Google makes more money.
Ad Rank now vs. then
To deepen your understanding of AdWords, I find it useful to take a quick trip down memory lane about the ad auction. Ad Rank used to be calculated like this:
Notice that Ad Rank is actually Cost Per Mille (CPM or cost per thousand impressions) in this equation! Over time, Google started to use a predicted rather than historical CTR, so we changed how we explained the formula and introduced the concept of Quality Score so we could stop talking about pCTR (predicted CTR).
Then we refined the algorithm to deal with some weird edge cases and rather than just multiplying the factors, the formula became more advanced. We communicated it as follows:
With this historical context, we see that the ad auction is basically a CPM auction where the way the CPM is calculated has evolved over time.
So even though advertisers place CPC bids, Google is awarding the best ad positions to advertisers who deliver the best CPM for Google (aka: those who provide more relevant ads that get the most clicks).
How Quality Score can reduce CPCs
As an example to show how this discounting of CPCs really works, let’s say there are two advertisers, Julie and Robert and they both bid a max CPC of $1. However they have different Quality Scores, a 5 and a 10.
| Bid | QS | Ad Rank | CPC | |
| Robert | $1 | 10 | 10 | $0.51 |
| Julie | $1 | 5 | 5 | $1 (or the auction minimum) |
As you can see, Robert (who’s winning the auction) actually pays a lower CPC than Julie, because his Quality Score is better.
Effective CPC for Robert = 5 / 10 + $0.01 = $0.51
This classic example oversimplifies the calculation of the CPC, however. For the example to be correct, we’d have to say that Robert’s CTR is twice that of Julie, and not just that his Quality Score number is twice that of Julie’s.
That’s because the visible QS number (between 1 and 10) is based on a non-linear assignment of a visible number to an underlying prediction of relevance.
To calculate the rank and CPC, Google uses a real-time prediction of CTR based on as many as hundreds of factors.
Real time Quality Score vs visible Quality Score
The Quality Score number between 1 and 10 that you see next to each keyword is simply an indicator and can be used to help prioritize what to optimize. After optimizations, it can be used to determine if improving relevance was achieved.
However, this number is NOT what is used in the Ad Rank formula.
Some indicators have more precision than others and there are also indicators that are linear and some that are not (the visible QS indicator is not necessarily linear).
The speedometer in a car and the signal strength bars on your cell phone are both linear, but the former is more precise than the latter. As you drive faster, your speedometer goes up precisely to tell you that you’ve increased speed. The bars on your cell phone, however, may take a while to go from one bar to two bars even though the signal strength has been gradually increasing for a while. Visible Quality Score is more like the phone’s signal strength indicator, except that there are 10 levels.
Articles claiming you can reduce your cost by 50% by doubling your QS number are oversimplifying, but they still make a valid point: that better Quality Score will lead to lower costs (assuming no jump in position).
The only way to reduce your CPC by half is by doubling your predicted CTR.
What factors go into Quality Score?
As an AdWords marketer, you want to get yourself a better Quality Score and a lower cost per click. There are several factors that go into Quality Score so let’s take a look at what those are:
- Ad relevance
- Expected CTR
- Landing page experience
Ad relevance
Ad relevance is an indicator of how well your ad text matches your keywords.
It’s usually a good idea to include the core concept of the keyword in your ad text, and to also include some compelling unique value propositions that will make your ad stand out from competitors. Over the years I’ve personally noticed that even minor changes in word choice can have drastic impacts on how well the user understands the ad.
For example, when eBay changed their ads to say, “buy it on eBay” instead of, “find it on eBay.” Because the word “buy” implies ecommerce, this got a far better CTR than the word ‘find’ which didn’t directly suggest one could buy the desired item.
Expected CTR
Expected CTR is an indicator of how likely your ad is to be clicked.
At the most basic level, this requires choosing good, relevant keywords, and grouping them in logical ad groups so that you can write compelling ads that get users to click.
Landing page relevance
Landing page relevance indicates how well your landing page meets the needs of users, and there are many ways you can go about improving this.
As an example, Joe Khoei from PPC agency SalesX (where I serve on the board) says that using Dynamic Text Replacement on Unbounce landing pages for the Children’s Learning Adventure helped his client increase conversion rates (calls and form fills) from 1.4% to 3.3% over 8 months.
Generally, using personalization features like DTR will correlate to better Landing Page Quality (LPQ) because users are getting what they want and that is what Google wants too: happy users who continue to engage with ads.

There’s an interesting tug of war between motives of landing page optimization; an optimization for conversion rate could hurt Quality Score, and Quality Score optimization could decrease conversion rates.
The trick is to find that right balance, and ideally aim to optimize where both QS and CR improve. Fortunately, they’re not mutually exclusive outcomes.
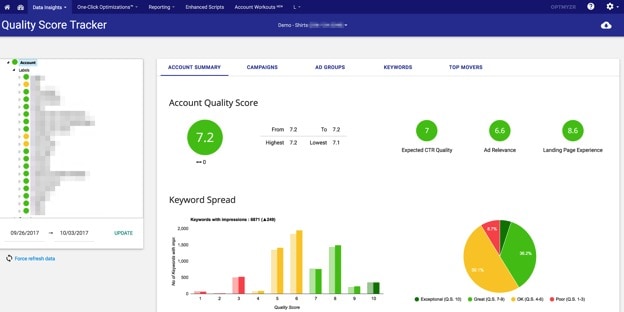
How to better track your Quality Score improvements
Once you make optimizations to your ads or landing pages with the goal of improving Quality Score, you’ll need to track if the changes are working. In this stage it’s critical you don’t lose sight of the bigger picture, which is to grow your business.
No executive ever said their goal for the company was to improve their QS next quarter. So remember, it’s a useful gauge to see if you could lower costs, but it’s not a business KPI.
Up until fairly recently, the easiest way to track changes in QS required using an AdWords Script, or signing up for a tool like Optmyzr, but now the data is also available directly in AdWords.
Additionally, tools like Optmyzr still make it easier to get historical QS data.
To get at the daily variations in AdWords, you have to do a few things:
- Use the old interface. The new one doesn’t include subcomponents yet.
- Look at the data with the segmentation for “day” turned on. Simply looking at the QS between two compared date ranges doesn’t get you the daily data because both fields will show the ending value.
To see how your QS has evolved based on changes to your landing pages, turn on the landing page component in the AdWords interface and then download the data with a daily segment.
You’ll end up with columns like this:
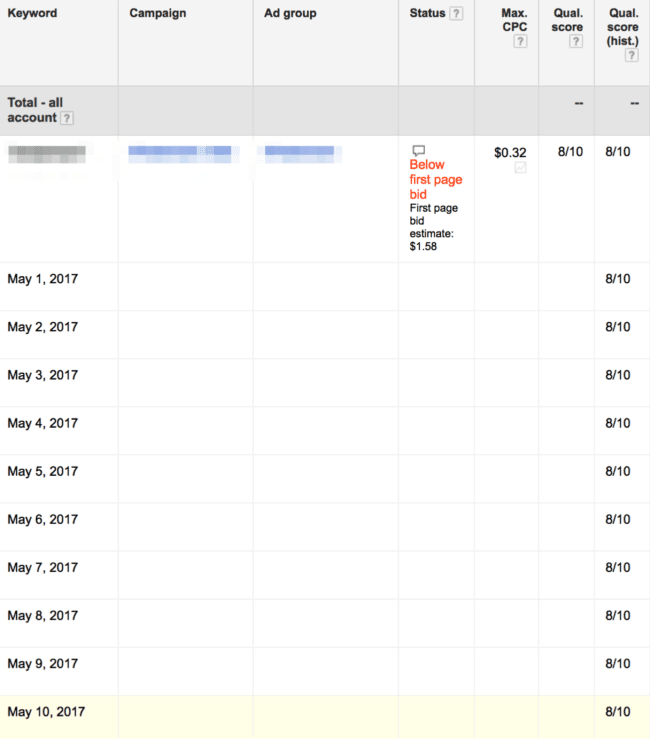
After exporting this data, you can use a simple spreadsheet formula that compares the current value to the historical one, e.g. =IF(A2=B2,1,0), so that the field will contain a 1 if the value has remained the same.
From there, filter these out and you’ll see only instances where the LPQ has changed. This will help you see where optimizations to your landing pages are positively affecting LPQ as a subfactor in Quality Score.
The purpose and importance of landing page quality
Landing page was the last component to be added to Quality Score and I was still on the team when we made this change. We had come to realize that it was too easy for advertisers to game the system by writing must-click ads, but then lead the user to a not so spectacular landing page, and in some cases even to a scammy site.
We had to start looking at what happened after the click, so we used both manual processes with the policy team and automated ones through the QS indicator to find sites that weren’t delivering a great experience.
What matters for landing page quality?
Here are some of the things Google cares about for landing pages:
- The page needs to deliver what the ad promises
- The user’s privacy and personal information must be protected
- The page should be transparent about its purpose
- The landing page should let users freely navigate the web
- The page should load quickly
Deliver what the ad promises
The first part should be the easiest to abide by. After all, if you want to drive conversions, you should be doing CRO and you should take users to landing pages that are relevant to what you offer in your ads.
Protect the user’s privacy
Privacy gets a little trickier.
What Google wants here is that you don’t share user’s information with third parties without their permission. So if you’re collecting leads and reselling these, you could be running into LPQ issues.
Be transparent about the page’s purpose
This also rolls into transparency.
If you’re a middleman, you need to be upfront about that. Affiliates who create thin landing pages and doorway pages are likely to run into LPQ issues because they usually add very little value and yet force the user to go through an extra step to get to where they wanted to go in the first place.
Allow users to freely navigate
Providing options is another tricky one for advertisers who deploy landing pages for their ads rather than taking the user to the most relevant page on their site. At issue here is that the user can do only do two things on most of these pages: instantly convert, or go away. Even a user who is interested in what you offer may not reach the comfort level needed to submit their info right away and if they can’t find more info by browsing the main site, their only real option is to go away and that is seen as a bad thing by Google.
While it can be a best practice to have a classic landing page perform only one goal and not include navigation or distractions, what I’m advocating for here is that you consider the allocation of your paid spend to a combo of the right, most relevant pages (whichever they may be).
That is – consider for each keyword or ad group which page on your site (or which landing page) may be best to serve up for a given situation. You may be pointing paid traffic to a landing page that is too high commitment for someone at the top of the funnel and this could hurt your Quality Score if someone’s only option is to convert or bounce. It’s a matter of their perceived readiness.
To ensure you’re not penalized this way, get strategic and point your paid traffic to highly relevant pages, either on your site, or build more valuable, relevant landing pages for each stage of the buying process to access via your ads. By having especially relevant landing pages that present the right offer at the right time, you should be able to avoid the issue of options as visitors will be served up the right option for them on their journey.
Again, if you have a great offer, and a decent site, the idea is that users should be able to get all their questions answered before being asked to turn over their details.
Landing page speed
And finally, the speed of your landing page is very important as a factor Google considers.
Just know Google is not actually that stringent and so long as your landing page is not an outlier in terms of slowness, you’ll be fine.
But you should still care tremendously about load times because as a 2017 study by Akamai found, a 100-millisecond delay in website load time can hurt conversion rates by 7 percent and a two-second delay in web page load time increase bounce rates by 103 percent.
Google’s Group Product Manager for AdWords, Jon Diorio, recently shared a stat from SOASTA that a 1 second delay in landing page load times can decrease retail conversion rates by 20%.
Pay close attention to signals about whether landing page visitors are satisfied
When I was at Google and I gave presentations at industry events about Quality Score, someone would always ask how we measured landing page quality. While I couldn’t answer that question directly then, and still can’t today, I recommend that you pay close attention to signals like bounce rates and time on site.
Google Analytics is a great way to track these signals which are fundamentally a measure of how satisfied users are with your landing pages.
If a user sees an ugly page, a page that takes too long to load, or one that seems off topic for what the ad promised, they will use the back button and try their luck at the next site.
Whether you’re using Unbounce or not, you are hopefully already paying close attention to these things. After all, this is part of CRO. If a user doesn’t stay long enough to consider your offer, they surely won’t have time to convert and your cost for the click to get them to your page will have been wasted.
")
