What’s a good conversion rate? (Based on 41,000 landing pages)
Not all conversions are created equal—and neither are conversion rates.
The number that counts as “good” isn’t one-size-fits-all. It depends on your industry, your audience, and how people find your page in the first place.
TABLE OF CONTENTS

Josh Gallant
Josh is the founder of Backstage SEO, an organic growth firm that helps SaaS companies capture demand. He’s a self-proclaimed spreadsheet nerd by day, volunteer soccer coach on weekends, and wannabe fantasy football expert every fall.
» More blog posts by Josh Gallant
In this article, we’re focusing specifically on landing page conversion rates across different industries, traffic channels, and device types.
Here’s what we’ll cover:
- Current baseline conversion rates (the real numbers, not wishful thinking)
- Industry-specific benchmarks (so you can see how you stack up)
- Practical tactics to improve your numbers (because knowing isn’t enough)
Every stat you’ll see comes straight from Unbounce’s 2024 Conversion Benchmark Report, based on real data from over 57 million conversions, 41,000 landing pages, and 464 million pageviews.
What’s an average conversion rate or baseline conversion rate for landing pages?
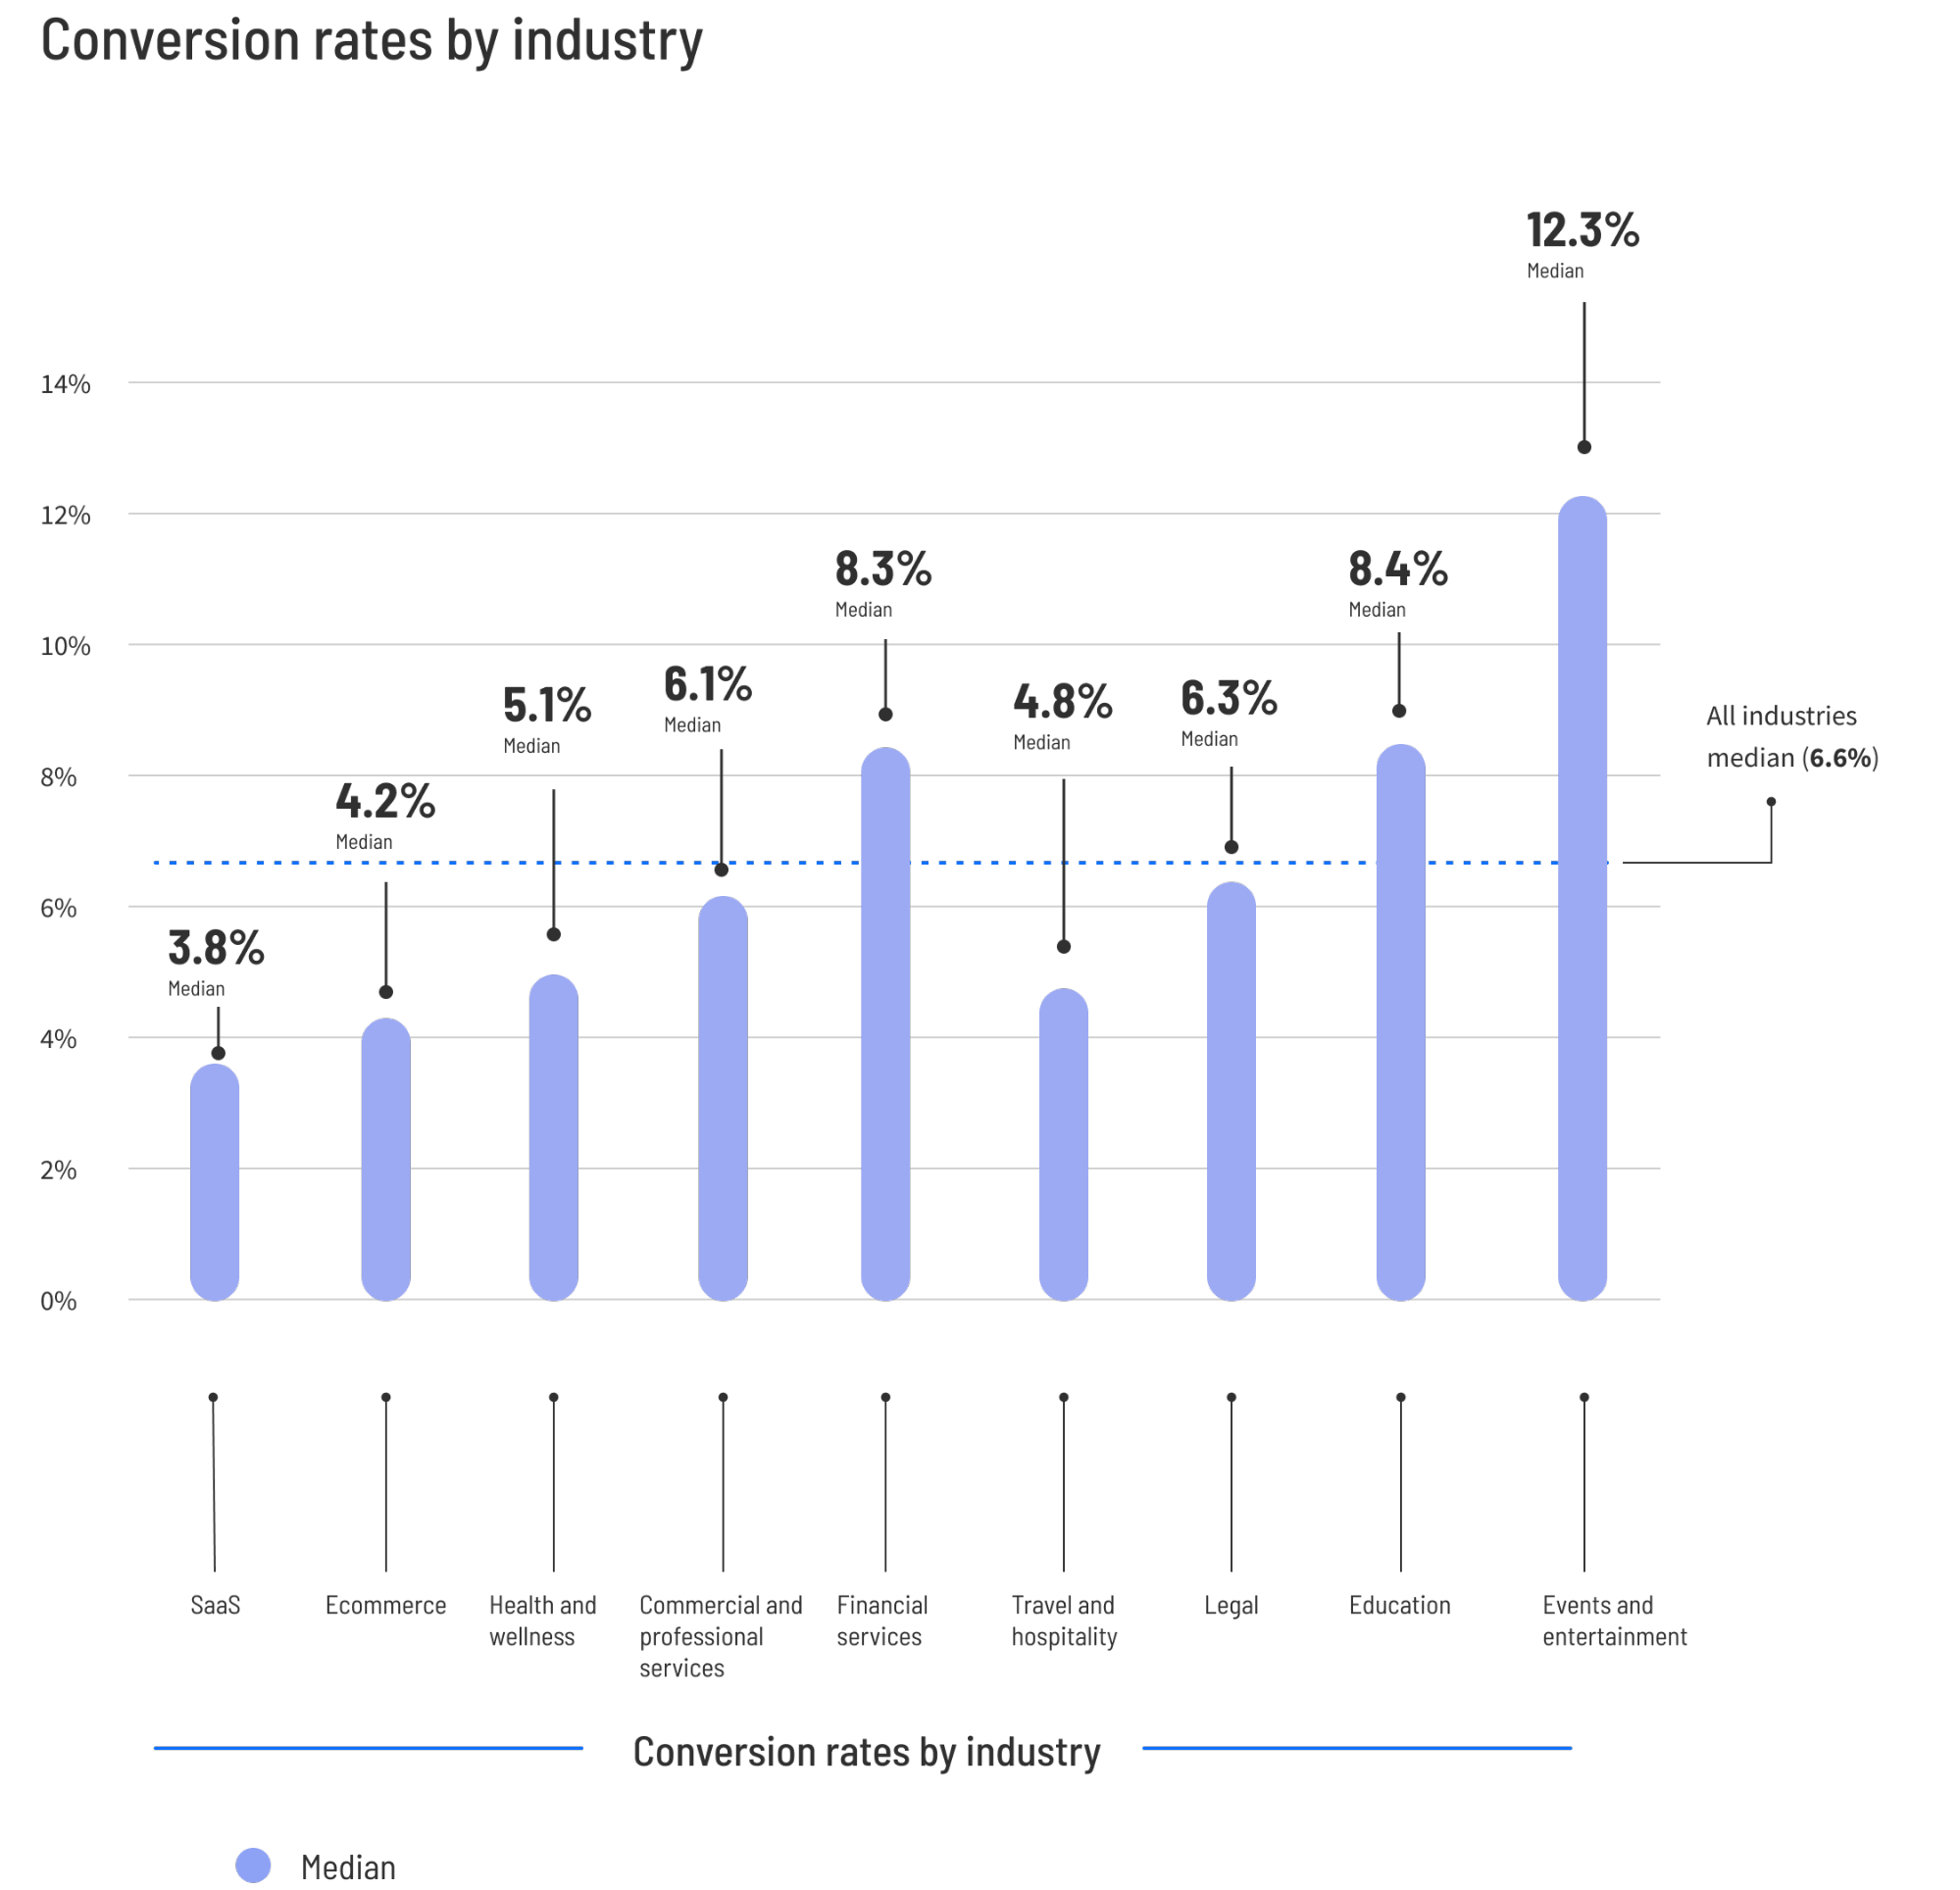
The median conversion rate for landing pages is 6.6% across all industries. This is your middle-of-the-pack number, the basic reference point.
But here’s the thing:
This isn’t a target to aim for. It’s just a baseline—and a very general one at that.
Think of it like the average height of all humans. It’s definitely a number, but on its own—it doesn’t tell you much about what’s average (or above average) for your specific demographic.
How successful your landing pages and CRO program are will ultimately depend far more on how well you’re tailoring both to your specific industry. Think targeted optimization strategies and a solid, industry-specific landing page strategy, not chasing generic averages.
In the sections below, we’ll break down what “good” actually means for your specific industry. Because as you’ll see, context changes everything.
And what’s considered a good conversion rate?
A good conversion rate starts around 11.4% and can reach as high as 40.8%, depending on your industry. These numbers represent the 75th percentile floor—meaning you’d need to beat these benchmarks to join the top-performing 25% of pages in your field.
Let’s put this in perspective:
Different industries have wildly different standards. A SaaS company offering a free trial plays a completely different game than an ecommerce brand running a flash sale.
For example, in SaaS, a good conversion rate might be 11.6%. But in the entertainment industry, you’d need to hit 40.8% to be considered a top performer.
Why such a big difference?
User intent, campaign type, and audience expectations all vary dramatically across industries.
Want to inch toward these top-tier numbers? Tracking the right metrics and running smart A/B tests can help you make consistent progress, no matter where you’re starting from. Keep in mind the goal still isn’t just to hit some arbitrary “good” number that implies you’re crushing it. It’s to keep improving what you’ve got and maximize the return on your marketing investments.
Average conversion rate vs median conversion rate
When we talk about conversion rates in this article, we’re using median values, not averages. There’s a good reason for that. First, let’s clear up the difference:
- Median: The value that sits exactly in the middle of the data set. Half the values are above it, half are below. It doesn’t get thrown off by wild outliers.
- Average: The sum of all numbers divided by how many there are. One extreme value can skew the entire result.
As an example, let’s use income. If you put Jeff Bezos in a room with 10 teachers, the “average” salary would be in the (many, many) millions, but the “median” would be a teacher’s salary. Which one actually represents the typical person in the room?
That’s why the Conversion Benchmark Report uses medians in most cases. They don’t get skewed by those rare unicorn pages that convert at 90% or those poor strugglers at 0.001%.
With a dataset of 41,000+ landing pages, the sample size is large enough too for the median gives us the true middle of the pack—what you can realistically compare yourself against. For practical purposes here, you can consider the average and median conversion rate baselines to be fairly interchangeable.
How conversion rates compare across industries
Comparing your conversion rate to some generic internet average is like comparing apples to, well, the entire fruit section at the grocery store.
Each industry below has its own story to tell. The median gives you a realistic middle-ground (what most marketers are actually seeing), while the “good” figure shows you the 75th percentile—the threshold for joining the top performers in your field.
In other words, beat that “good” number, and you’re outperforming 75% of the competition in your specific industry. Not too shabby.
Want to see how your conversion rates stack up against your industry specifically?
Our full Conversion Benchmark Report breaks down even more details. And if you’re curious about B2B conversion rates in particular, we’ve got you covered there too.
Now let’s dig into the numbers…
Average ecommerce conversion rate
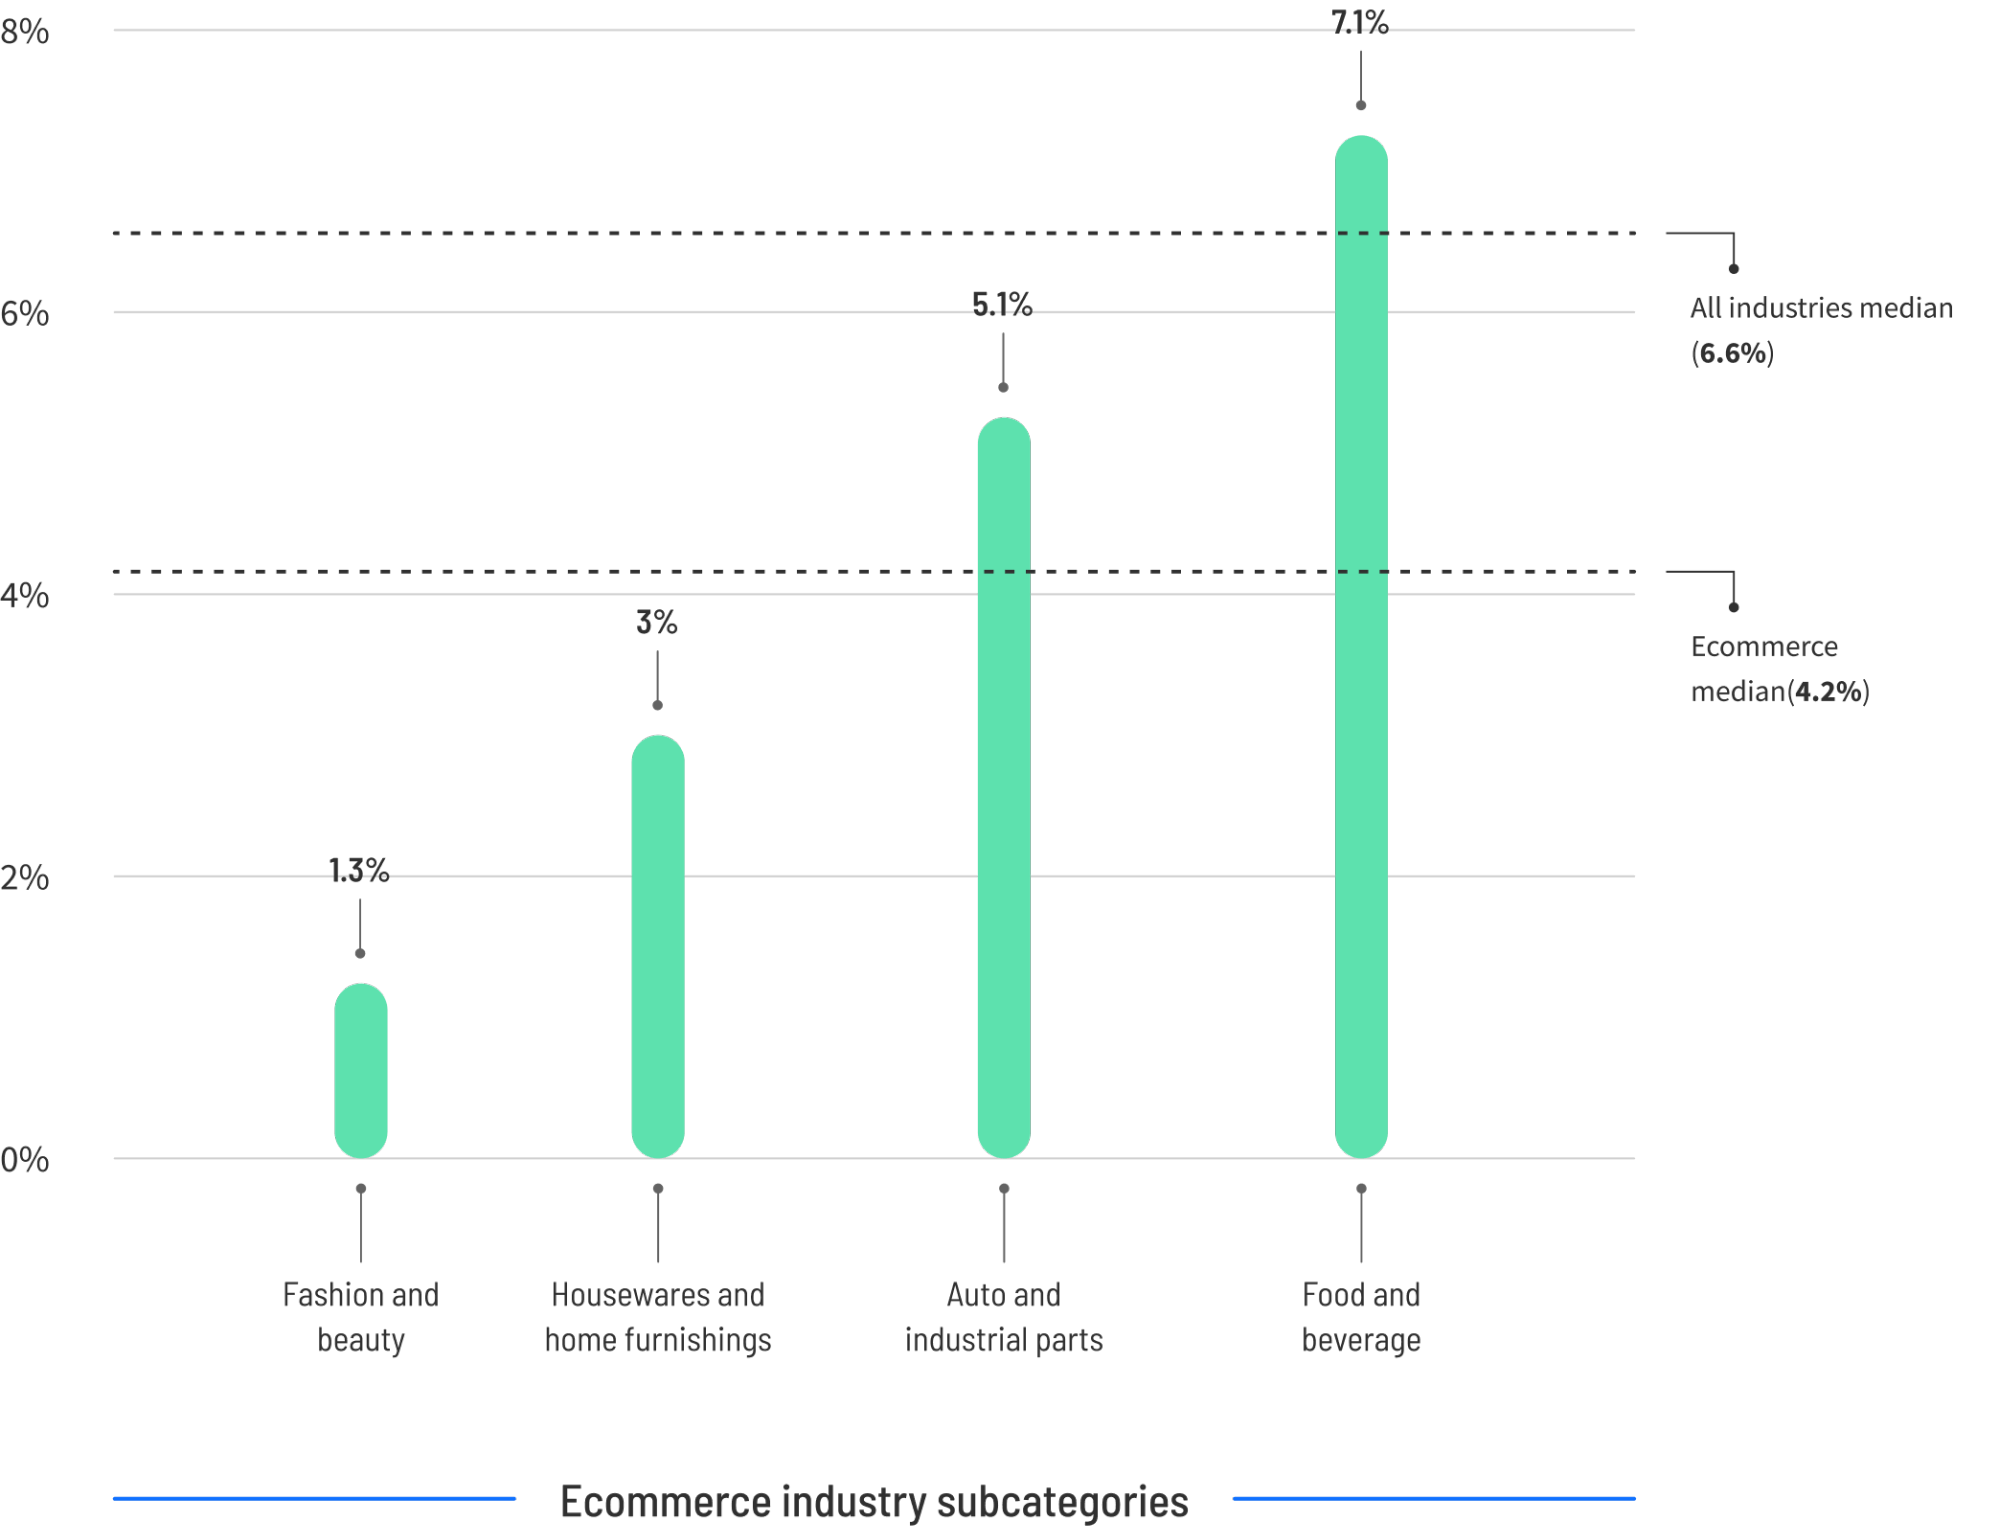
The median conversion rate for ecommerce landing pages is 4.2%. That’s what’s happening in the middle of the pack across product categories from fashion to electronics to home goods.
What does this mean for you?
If your ecommerce landing pages are converting above 4.2%, you’re already beating half the market. But don’t pop the champagne just yet—there’s still plenty of room to grow.
This figure reflects a broad mix of campaigns, from flash sales to product launches to seasonal promotions. Behind this number, you’ll find everything from direct-to-consumer brands to dropshippers to established retail players moving online.
Want to take your store’s performance to the next level? Take a peek at our guide on ecommerce CRO and our roundup of high-converting ecommerce landing page examples.
What’s a good ecommerce conversion rate?
A good ecommerce conversion rate starts at 11.4% or higher, which puts your pages in the top 25% of performers in the industry. That’s nearly triple the median rate!
Think about what that means in real terms:
If you’re getting 10,000 visitors to your landing pages each month, moving from 4.2% to 11.4% would mean an extra 720 conversions. For an ecommerce store with an average order value of even $75, that’s potentially $54,000 in additional monthly revenue.
Not all product categories are created equal, though. Food and beverage pages tend to convert higher (7.1% median), while fashion and beauty pages typically convert lower (1.3% median).
The takeaway? Context matters, but no matter your niche, there’s significant room between the average and what top performers are achieving.
Average SaaS conversion rate
The median landing page conversion rate for SaaS companies is 3.8%. This sits below the all-industry median of 6.6%, but there’s a good reason for it.
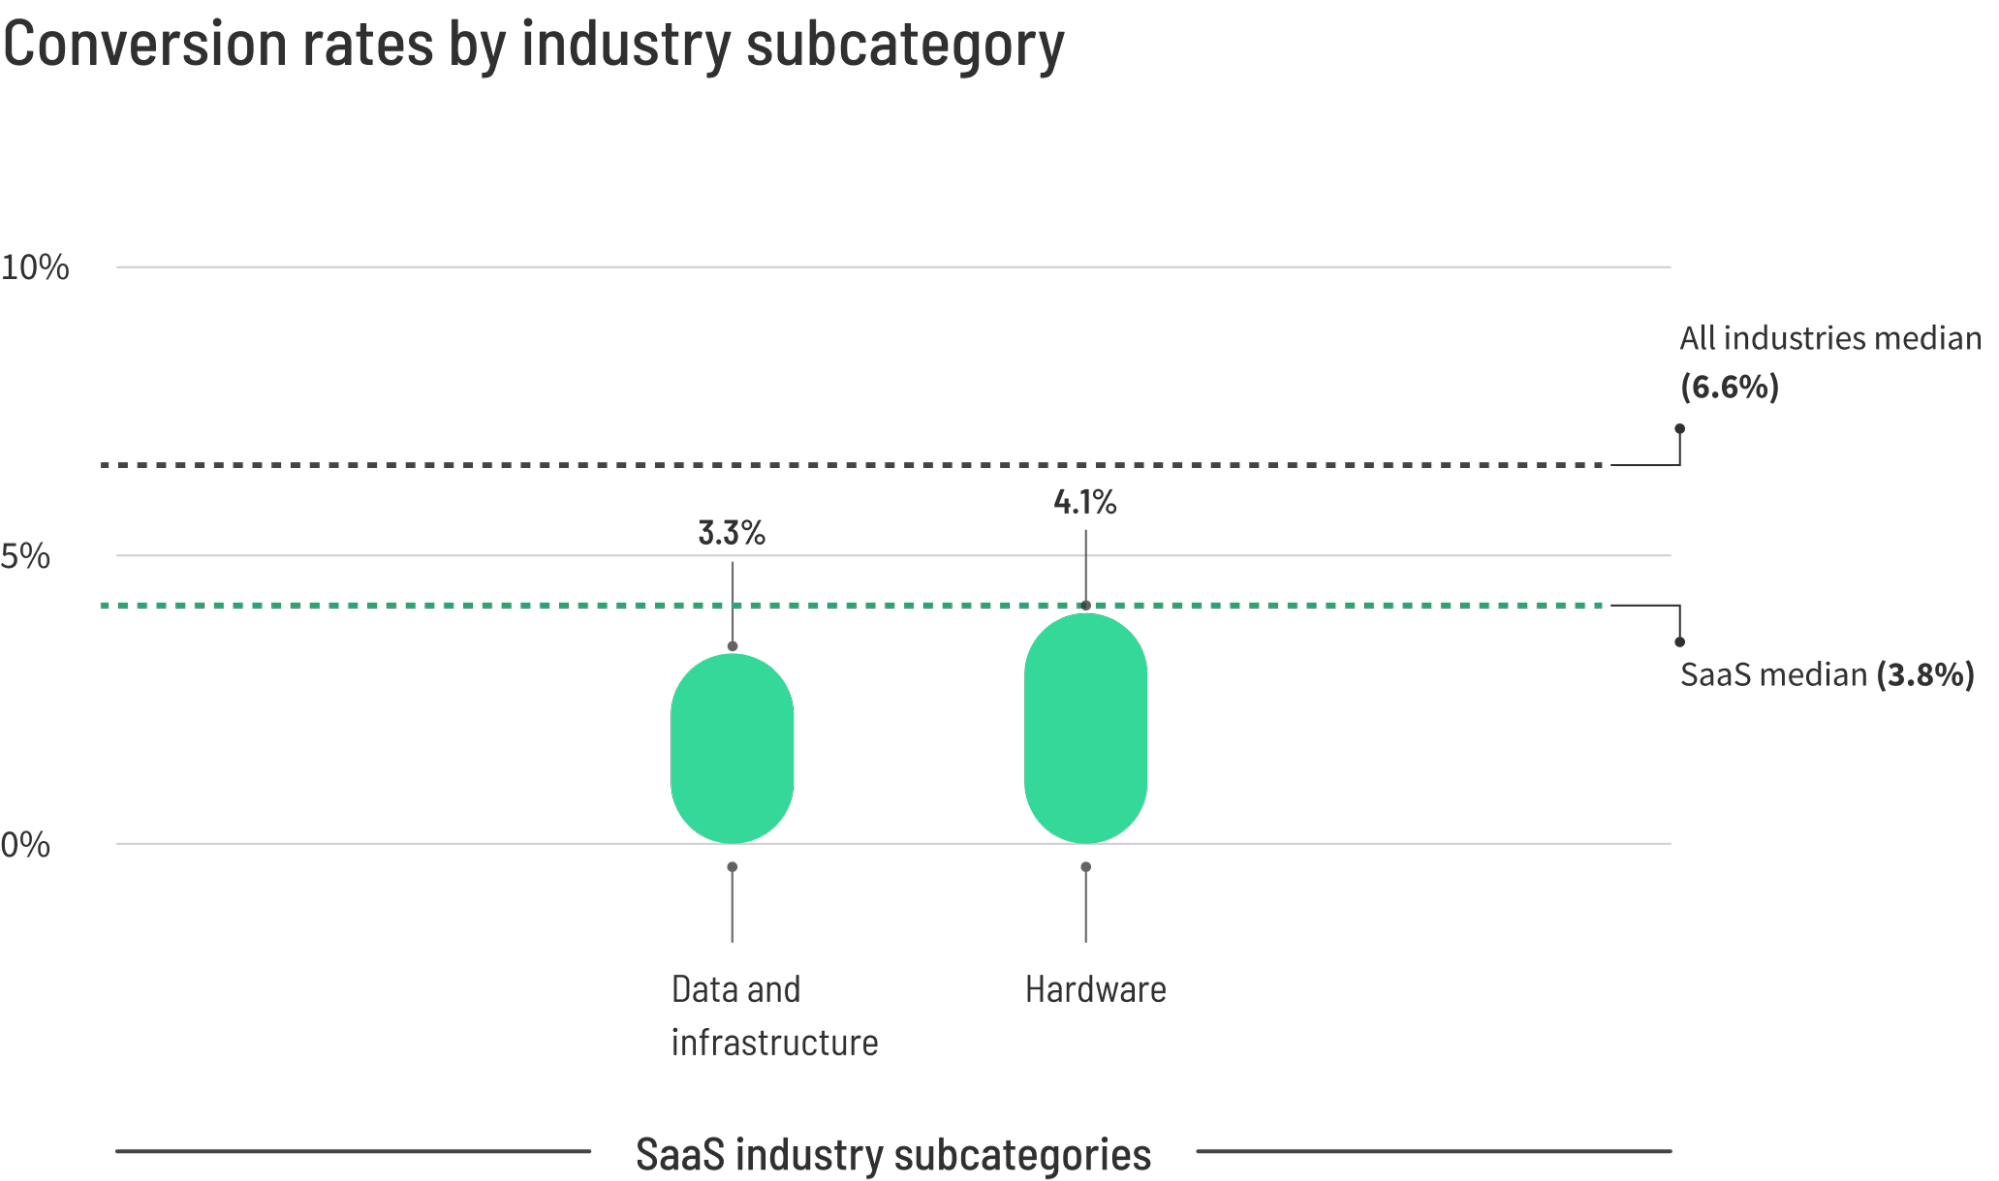
SaaS landing pages face unique challenges. They’re typically promoting complex products with longer sales cycles, often targeting visitors with widely varying levels of buying intent. The person who clicks an ad might be anywhere from “just researching options” to “ready to start a trial today.”
Breaking it down further, we see hardware-focused SaaS pages performing slightly better (4.1% median) than data and infrastructure solutions (3.3% median).
Curious how successful SaaS companies are structuring their pages? Check out our deep dives into top-performing SaaS landing pages and effective SaaS marketing strategies.
What’s a good SaaS conversion rate?
To break into the top 25% of SaaS landing pages, you’ll need a conversion rate of 11.6% or above.
The substantial gap between the median and top performers shows just how much optimization potential exists in this space.
What separates the high-performers? They’ve typically nailed their messaging to specific pain points, streamlined their forms, and created compelling offers that reduce perceived risk (like no-credit-card trials or money-back guarantees).
Average professional services conversion rate
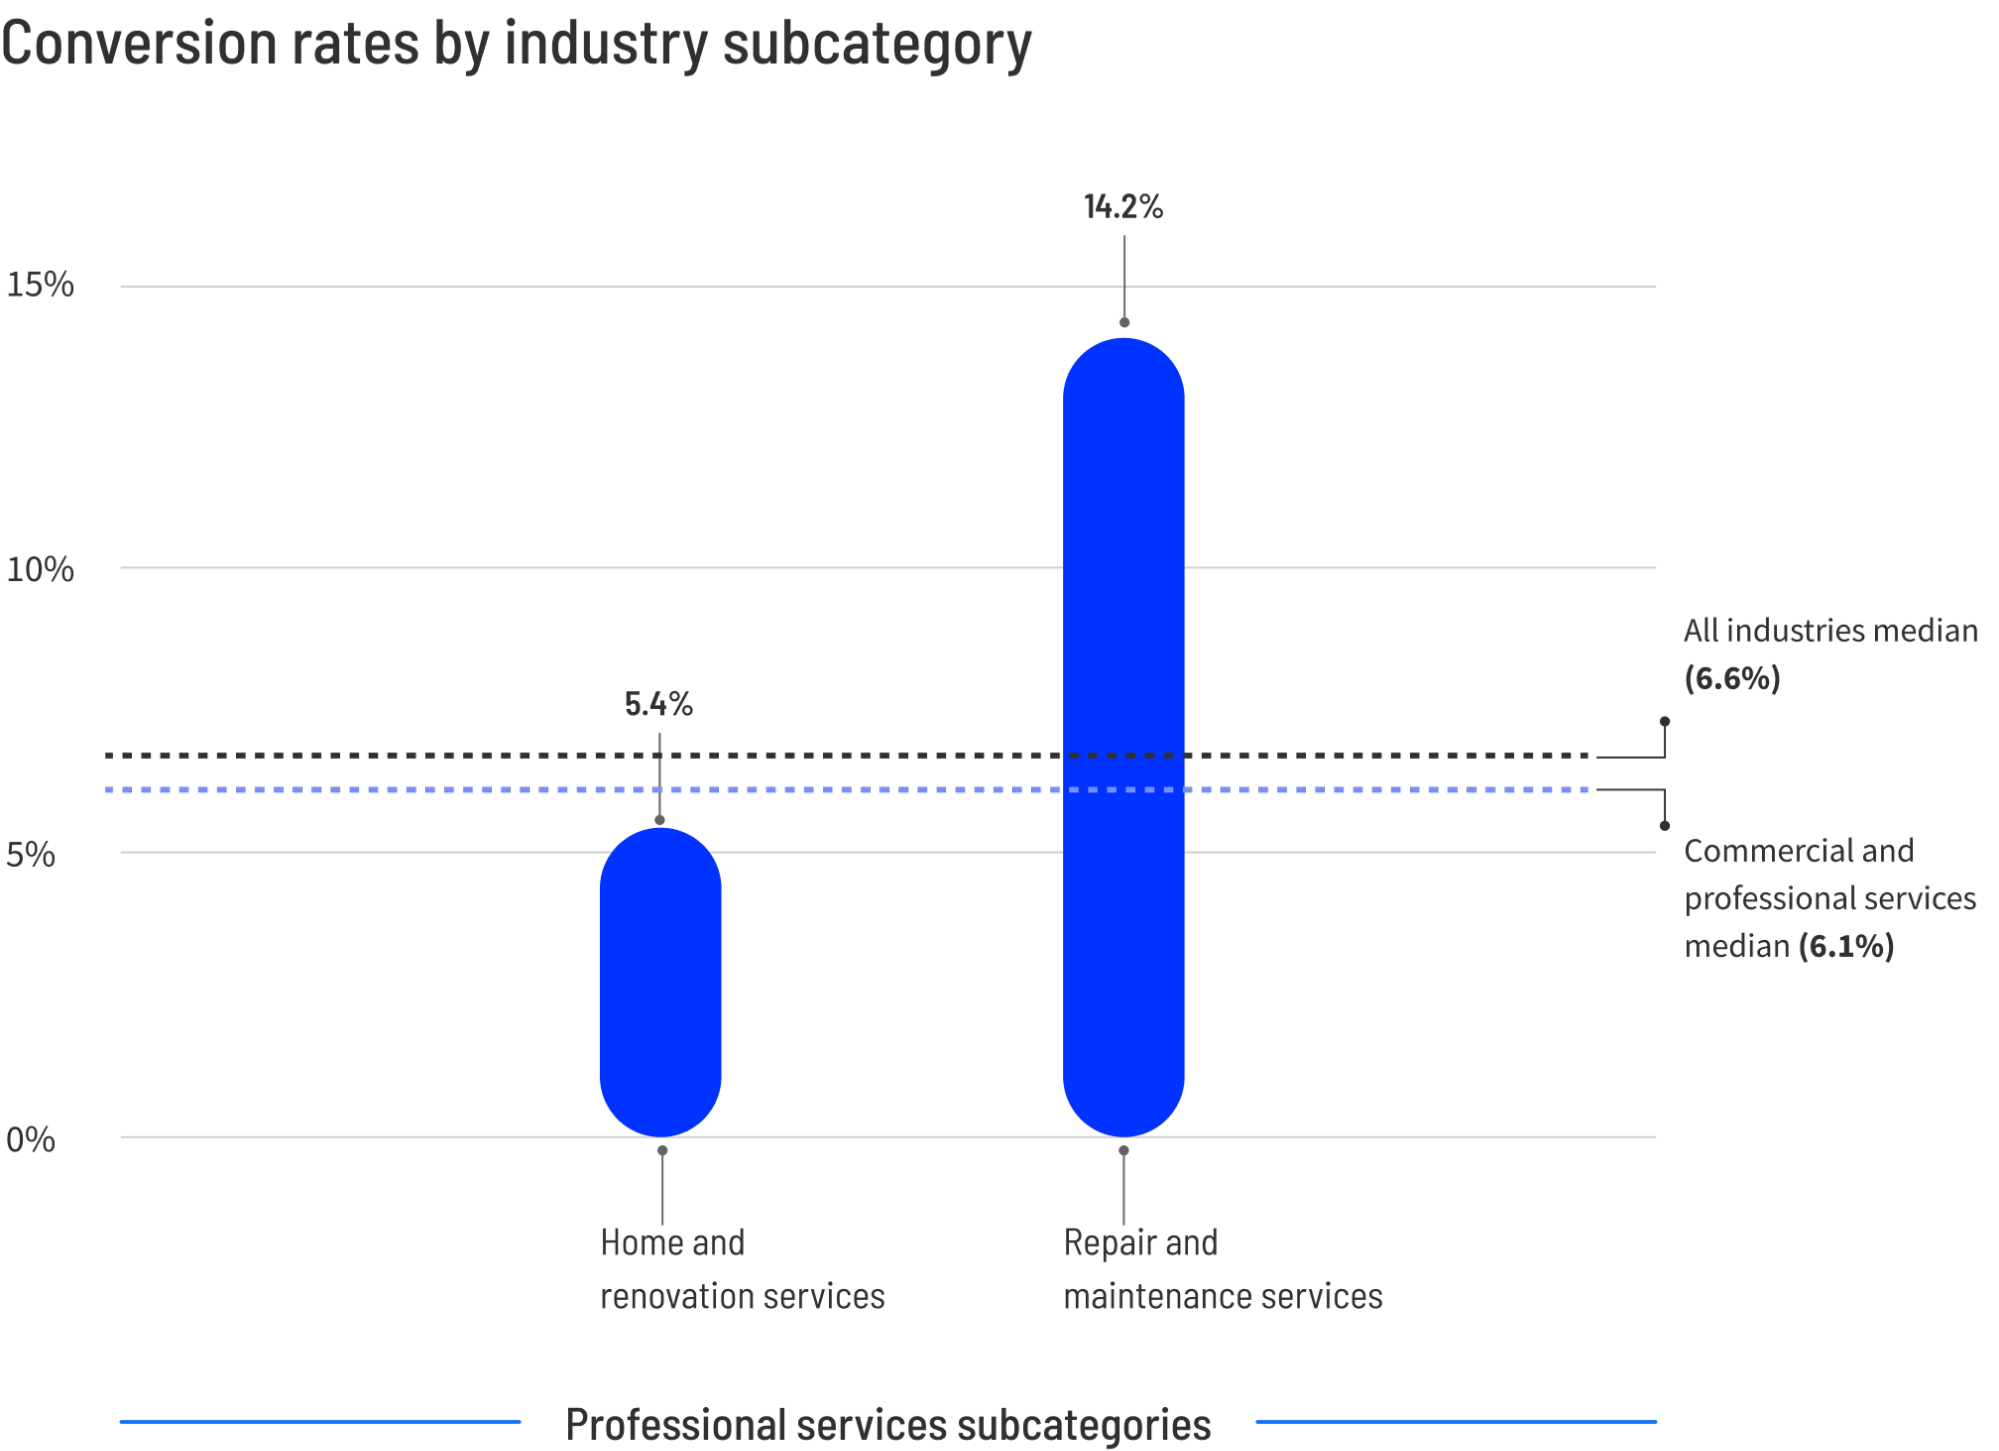
That said, this category’s pretty diverse—covering everything from law firms to consulting agencies to renovation services. Each has their own audience, their own challenges, and their own conversion stories to tell.
To illustrate this diversity, landing pages for repair and maintenance services convert almost 3x better than those for home renovation. Makes sense when you think about it—a broken pipe needs fixing now, while that kitchen remodel can wait.
What’s a good professional services conversion rate?
Want to join the top 25% of professional services pages? You’ll need to hit a conversion rate of 14.1% or higher. The jump from the 6.1% median to 14.1% is substantial. This gap shows how much potential exists when you truly dial in your messaging, demonstrate your expertise, and remove friction from your conversion path.
The businesses reaching these numbers aren’t necessarily bigger or more established—they’re just more strategic about how they present their services and capture leads.
And one big piece of that puzzle is which traffic sources you’re prioritizing. For example, in the professional services industry specifically, email traffic converts at almost 14%, while paid social traffic converts at just 4.4%.
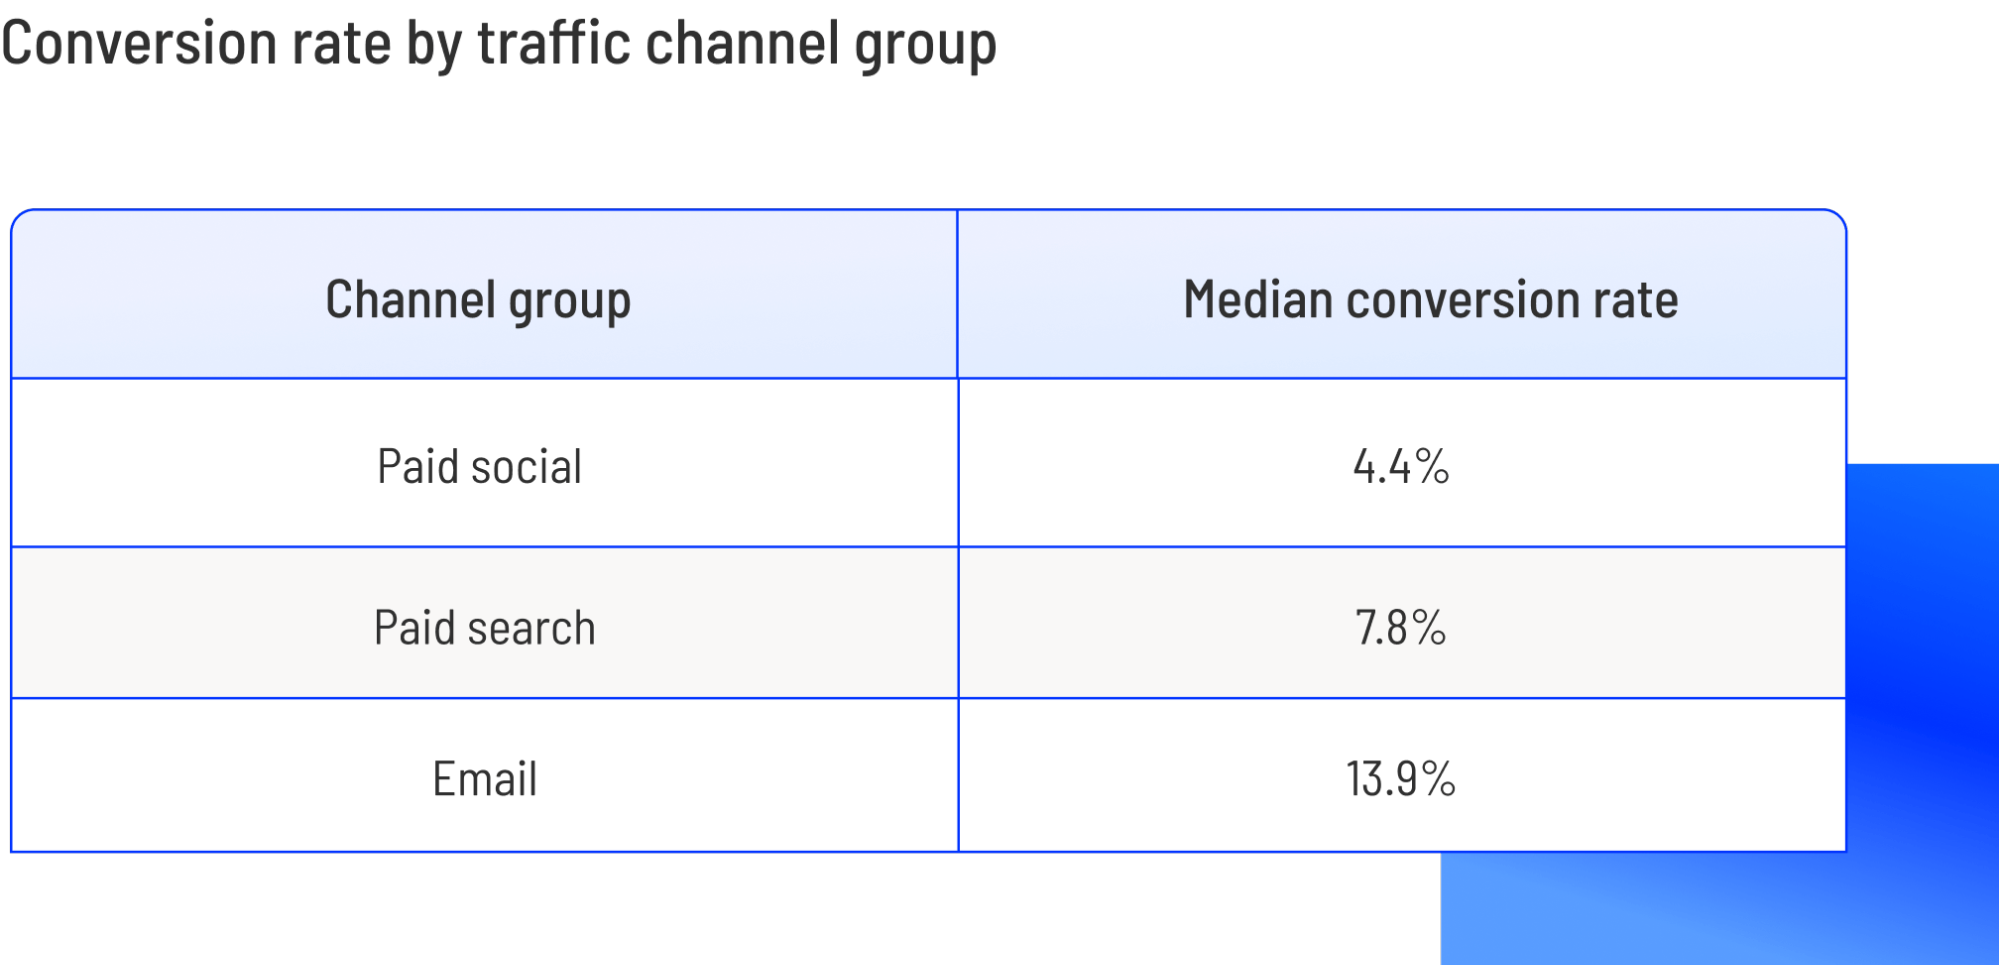
If you’re not nurturing an email list of past clients and prospects, you’re missing out on your highest-converting channel.
Average financial services conversion rate
The median conversion rate is 8.3% for landing pages in the financial services industry.
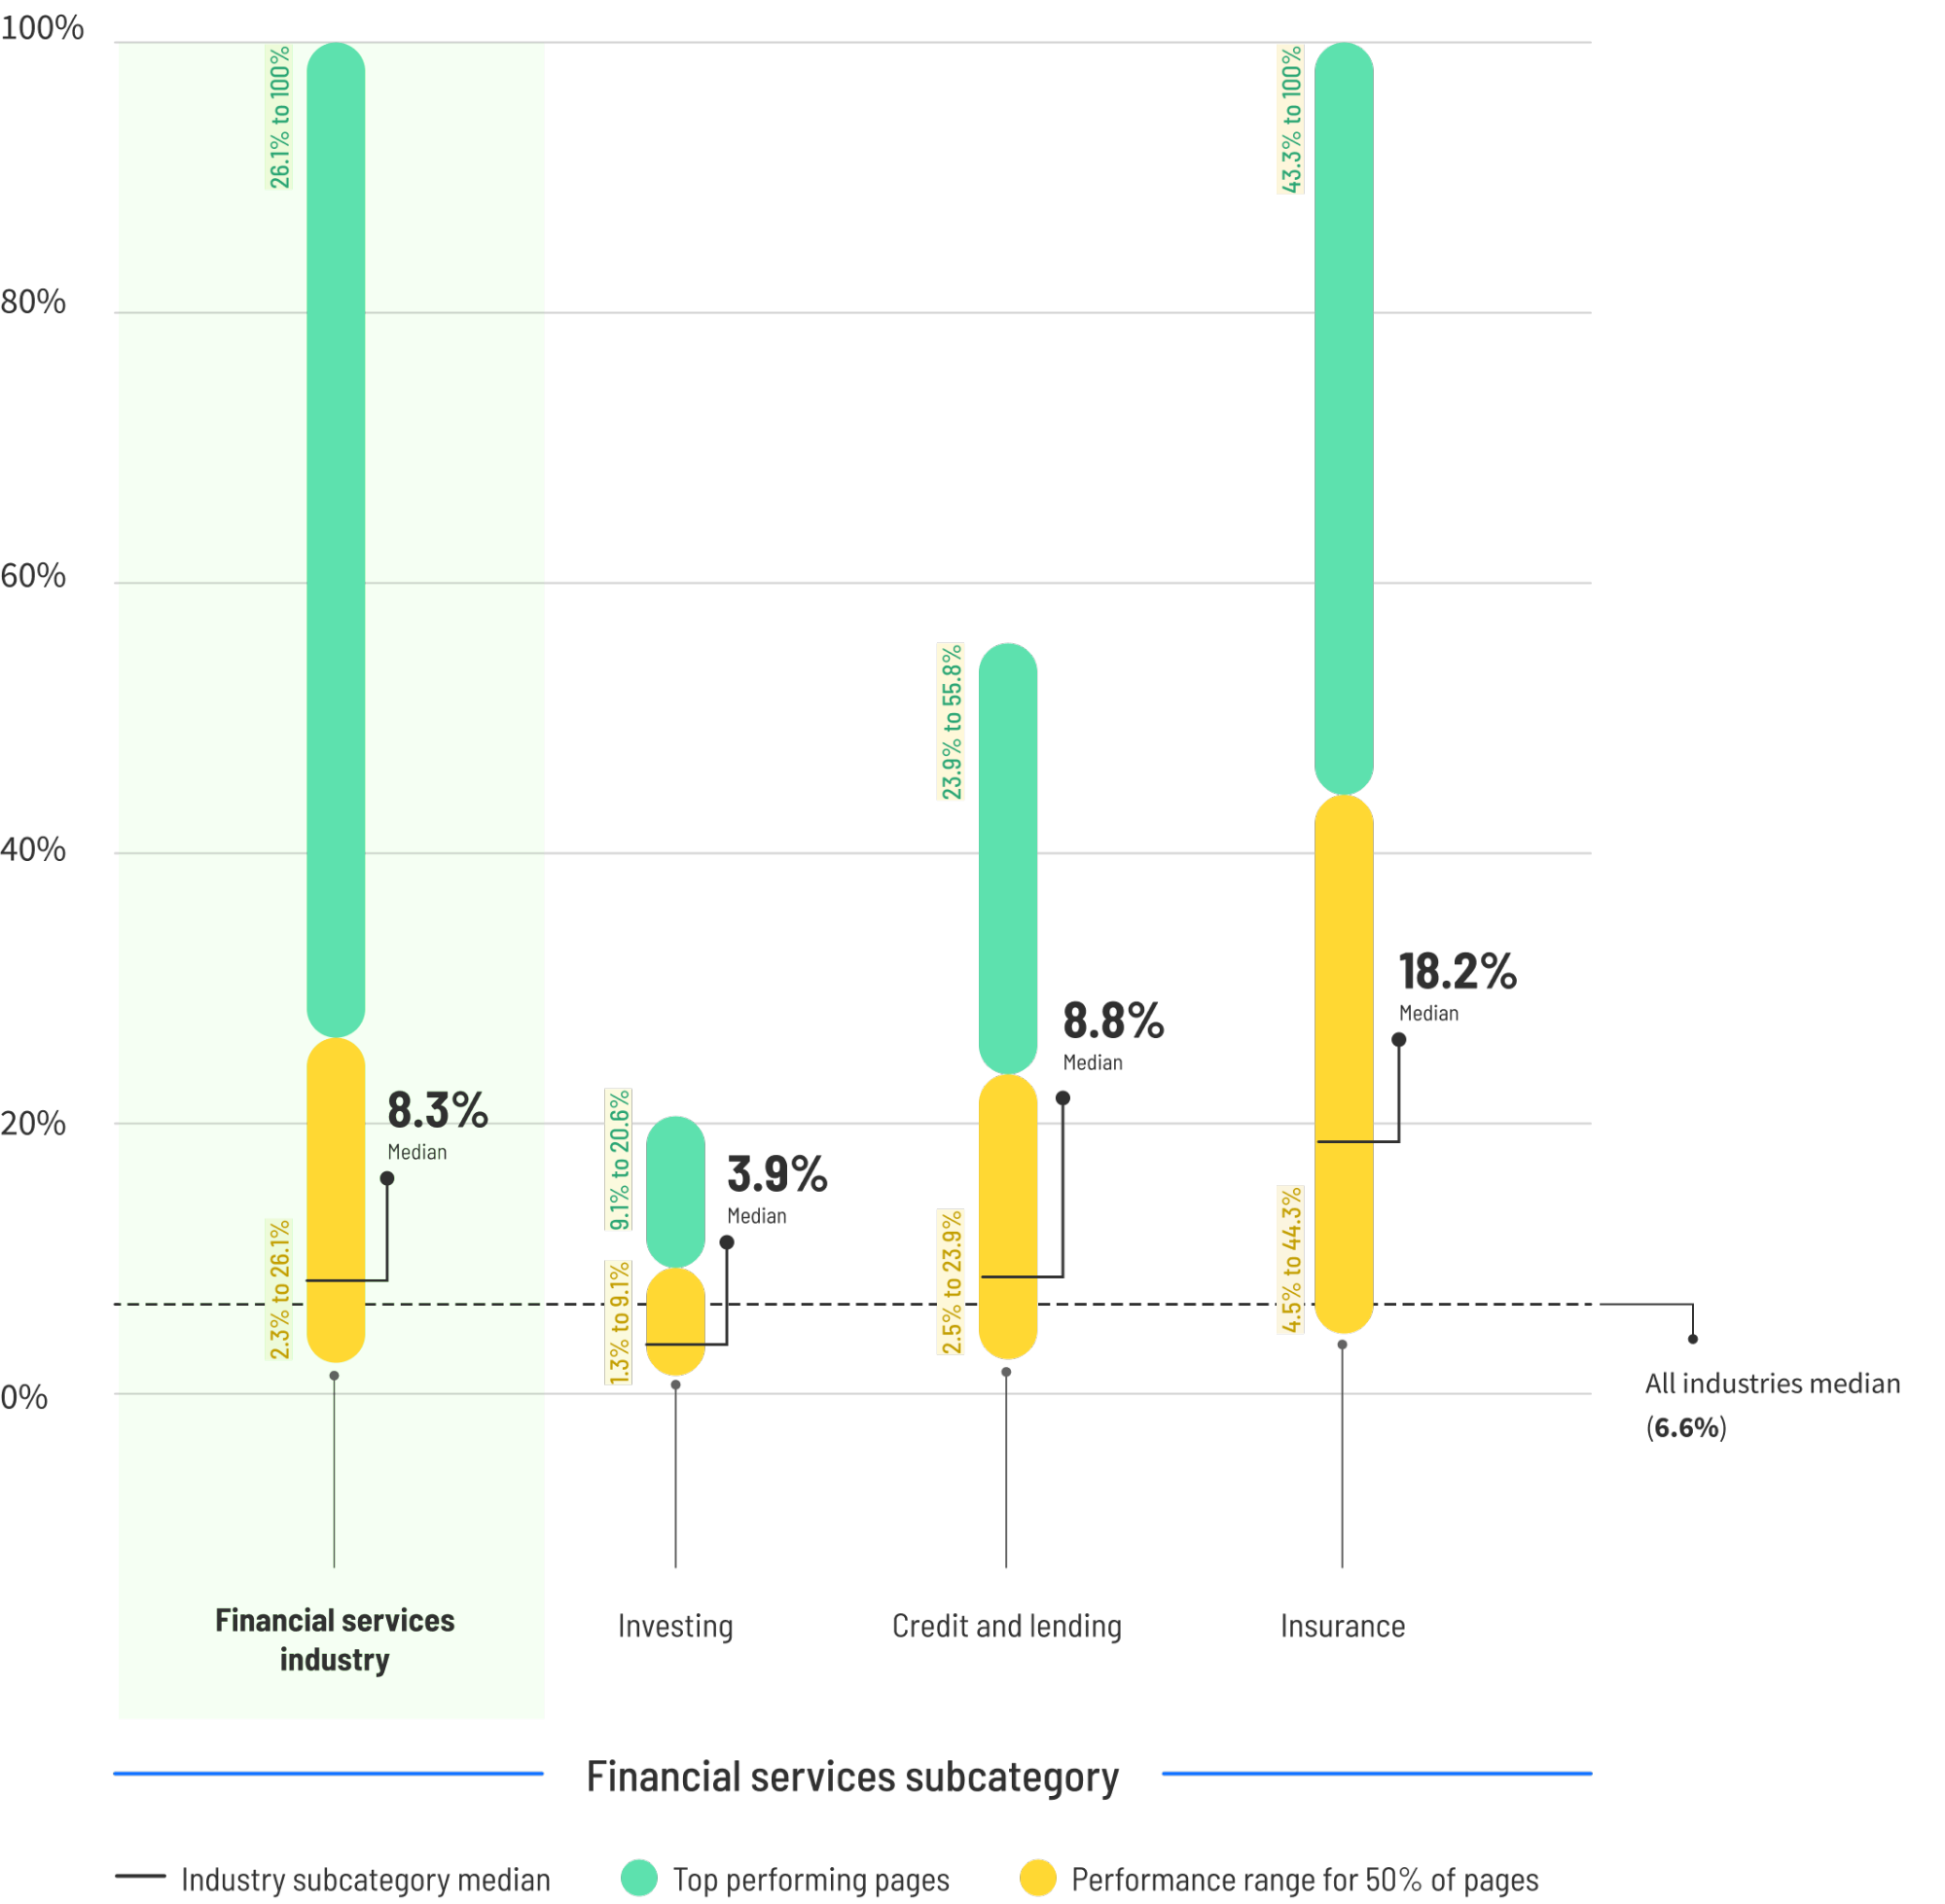
That’s well above the all-industry median. Here’s why that makes sense:
Financial decisions typically come with higher intent. Very few people are casually shopping for insurance or investment options the way they might browse fashion sites.
When we dig deeper into subcategories too, insurance pages crush it at 18.2%—more than double the industry median. Meanwhile, investing pages land at just 3.9%, showing how different offer types can dramatically shift performance even within the same field.
The financial services space is also heavily regulated, which makes the balancing act between compliance and conversion particularly tricky. If you’re in the insurance space in particular, take a peek at our roundup of the best insurance landing pages for some extra inspo.
What’s a good financial services conversion rate?
The top performing financial services landing pages typically convert at 26.1% or higher.
The companies hitting these numbers clearly understand their audience’s specific behavior patterns. For example, in this particular industry—mobile is massive. Mobile traffic actually converts 27.8% better than desktop in the financial services space (which is the opposite to most industries).
Prime example of optimizing for your specific industry rather than blindly following generalized trends or “best practices” with no context.
Average travel and hospitality conversion rate
Travel and hospitality pages convert at a median rate of 4.8%. This sits about 37% below the all-industry median of 6.6%. Look closer, and the story gets more interesting too.
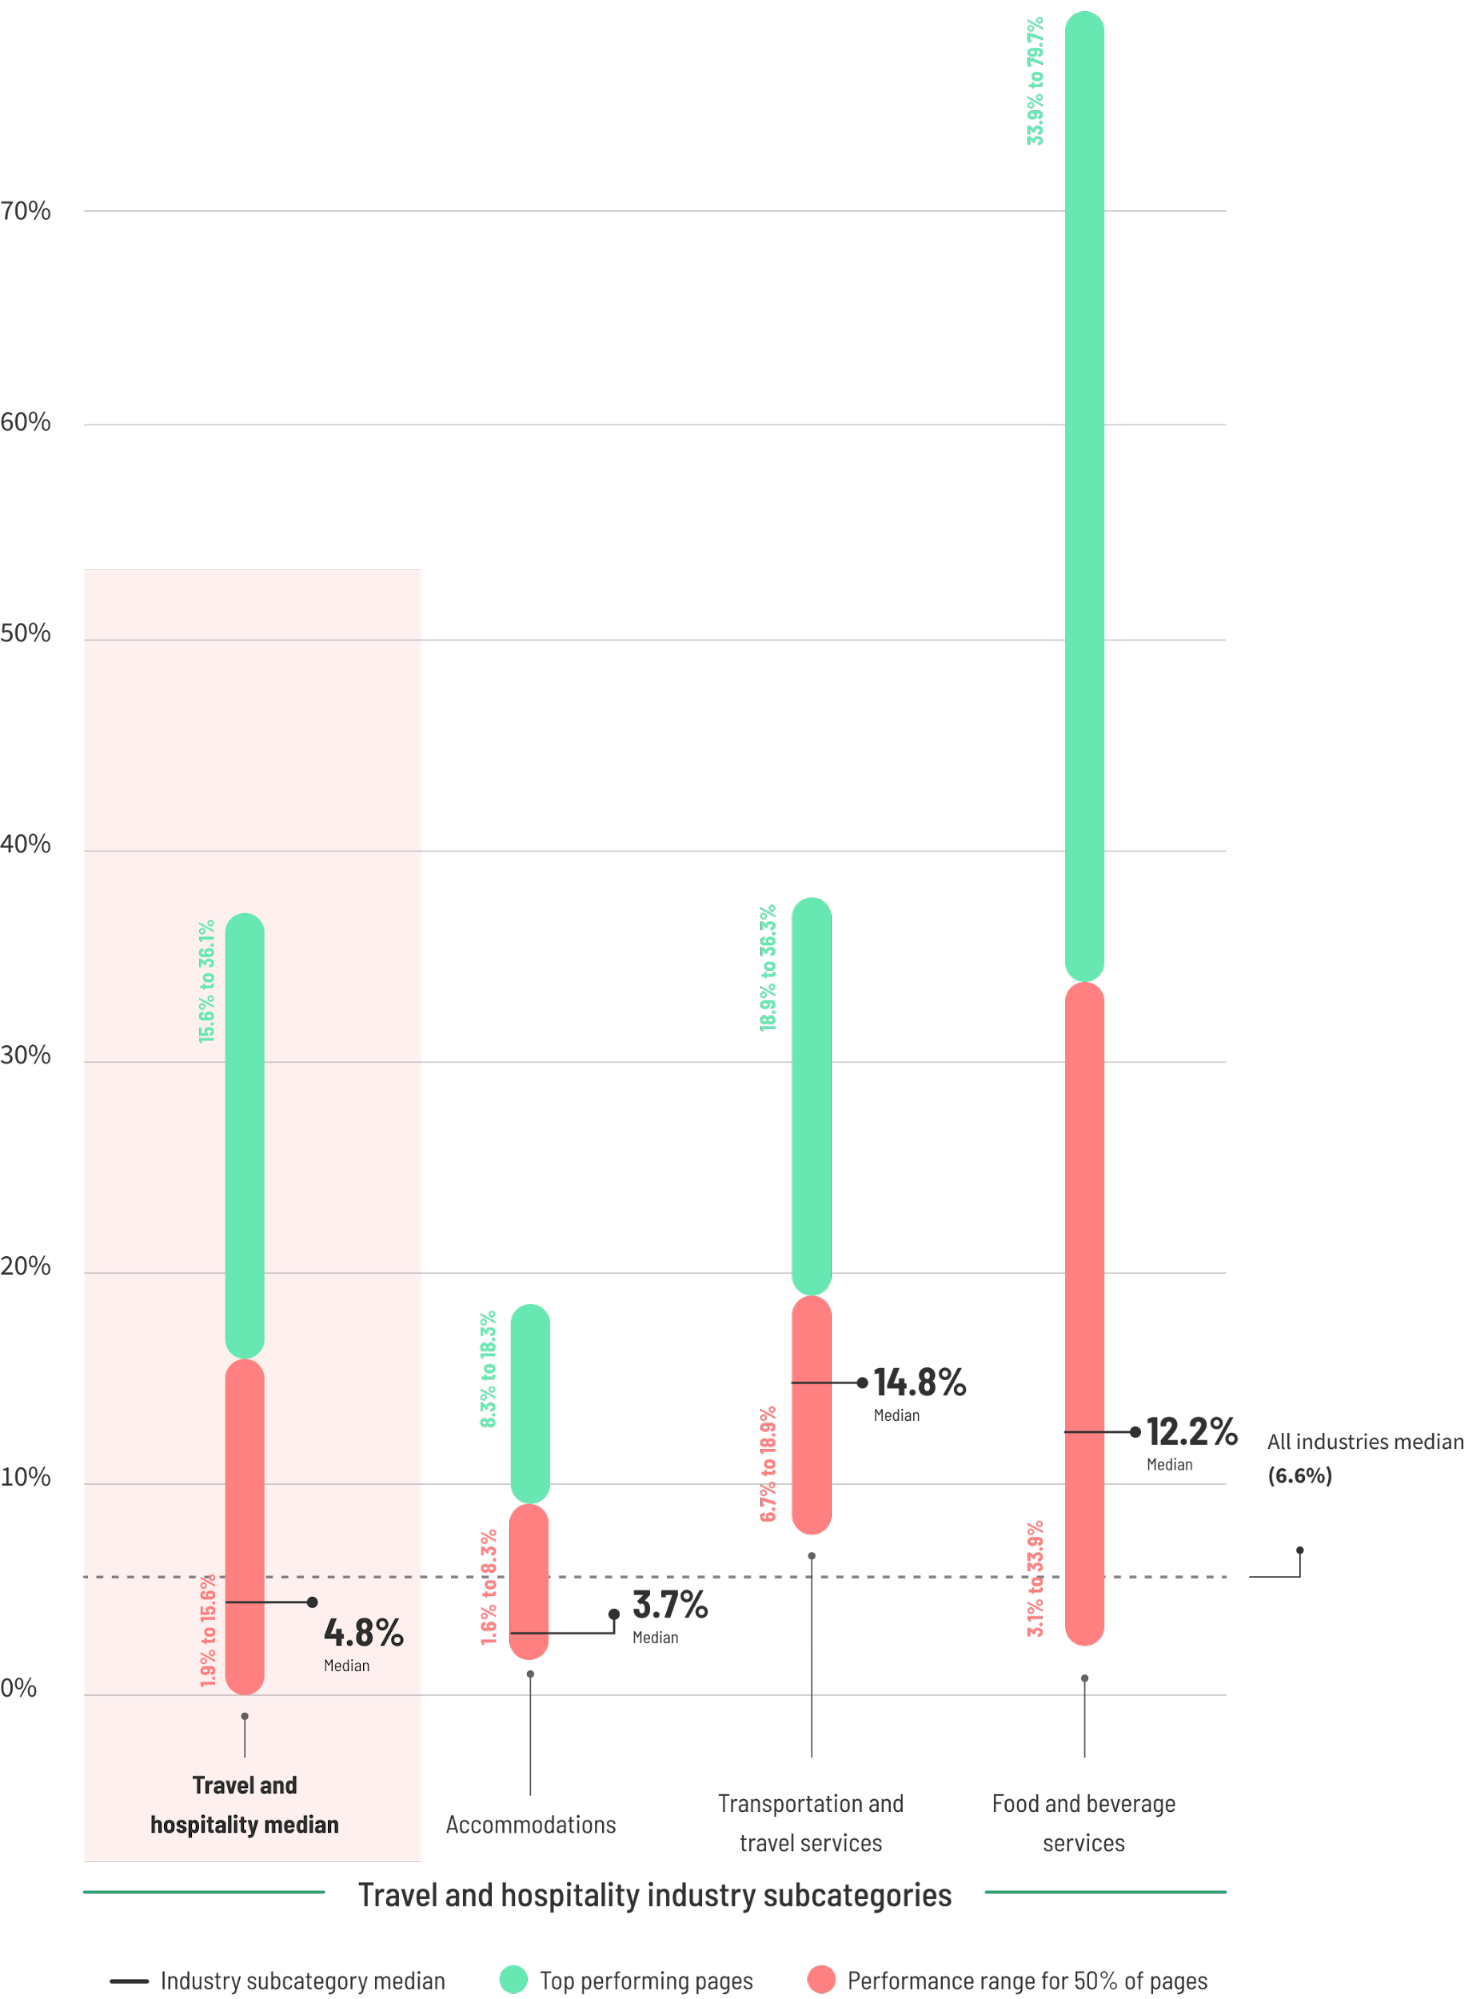
The accommodations subcategory (like hotels and vacation rentals) struggles at just 3.7%, while transportation and travel services pages are killing it at 14.8%.
Why such a big difference?
It could be that booking accommodations tends to be a high-consideration purchase with tons of comparison shopping. Meanwhile, transportation bookings (think airport shuttles or tour buses) are often more urgent, time-sensitive purchases with fewer alternatives.
Seasonality could also play a huge role here. A summer getaway campaign in February might convert dramatically better than the exact same offer promoted in late July when vacation plans are already set.
What’s a good travel and hospitality conversion rate?
The top 25% of travel and hospitality pages convert at 15.6% or higher—more than 3x the industry median.
The travel brands hitting these numbers likely understand how people actually plan trips today. Chances are, most research may start on mobile, but final bookings often happen on desktop—which is why desktop traffic converts 10.4% better than mobile in this industry.
Average legal conversion rate
Legal industry landing pages convert at a median rate of 6.3%, fairly close to the overall median of 6.6%.
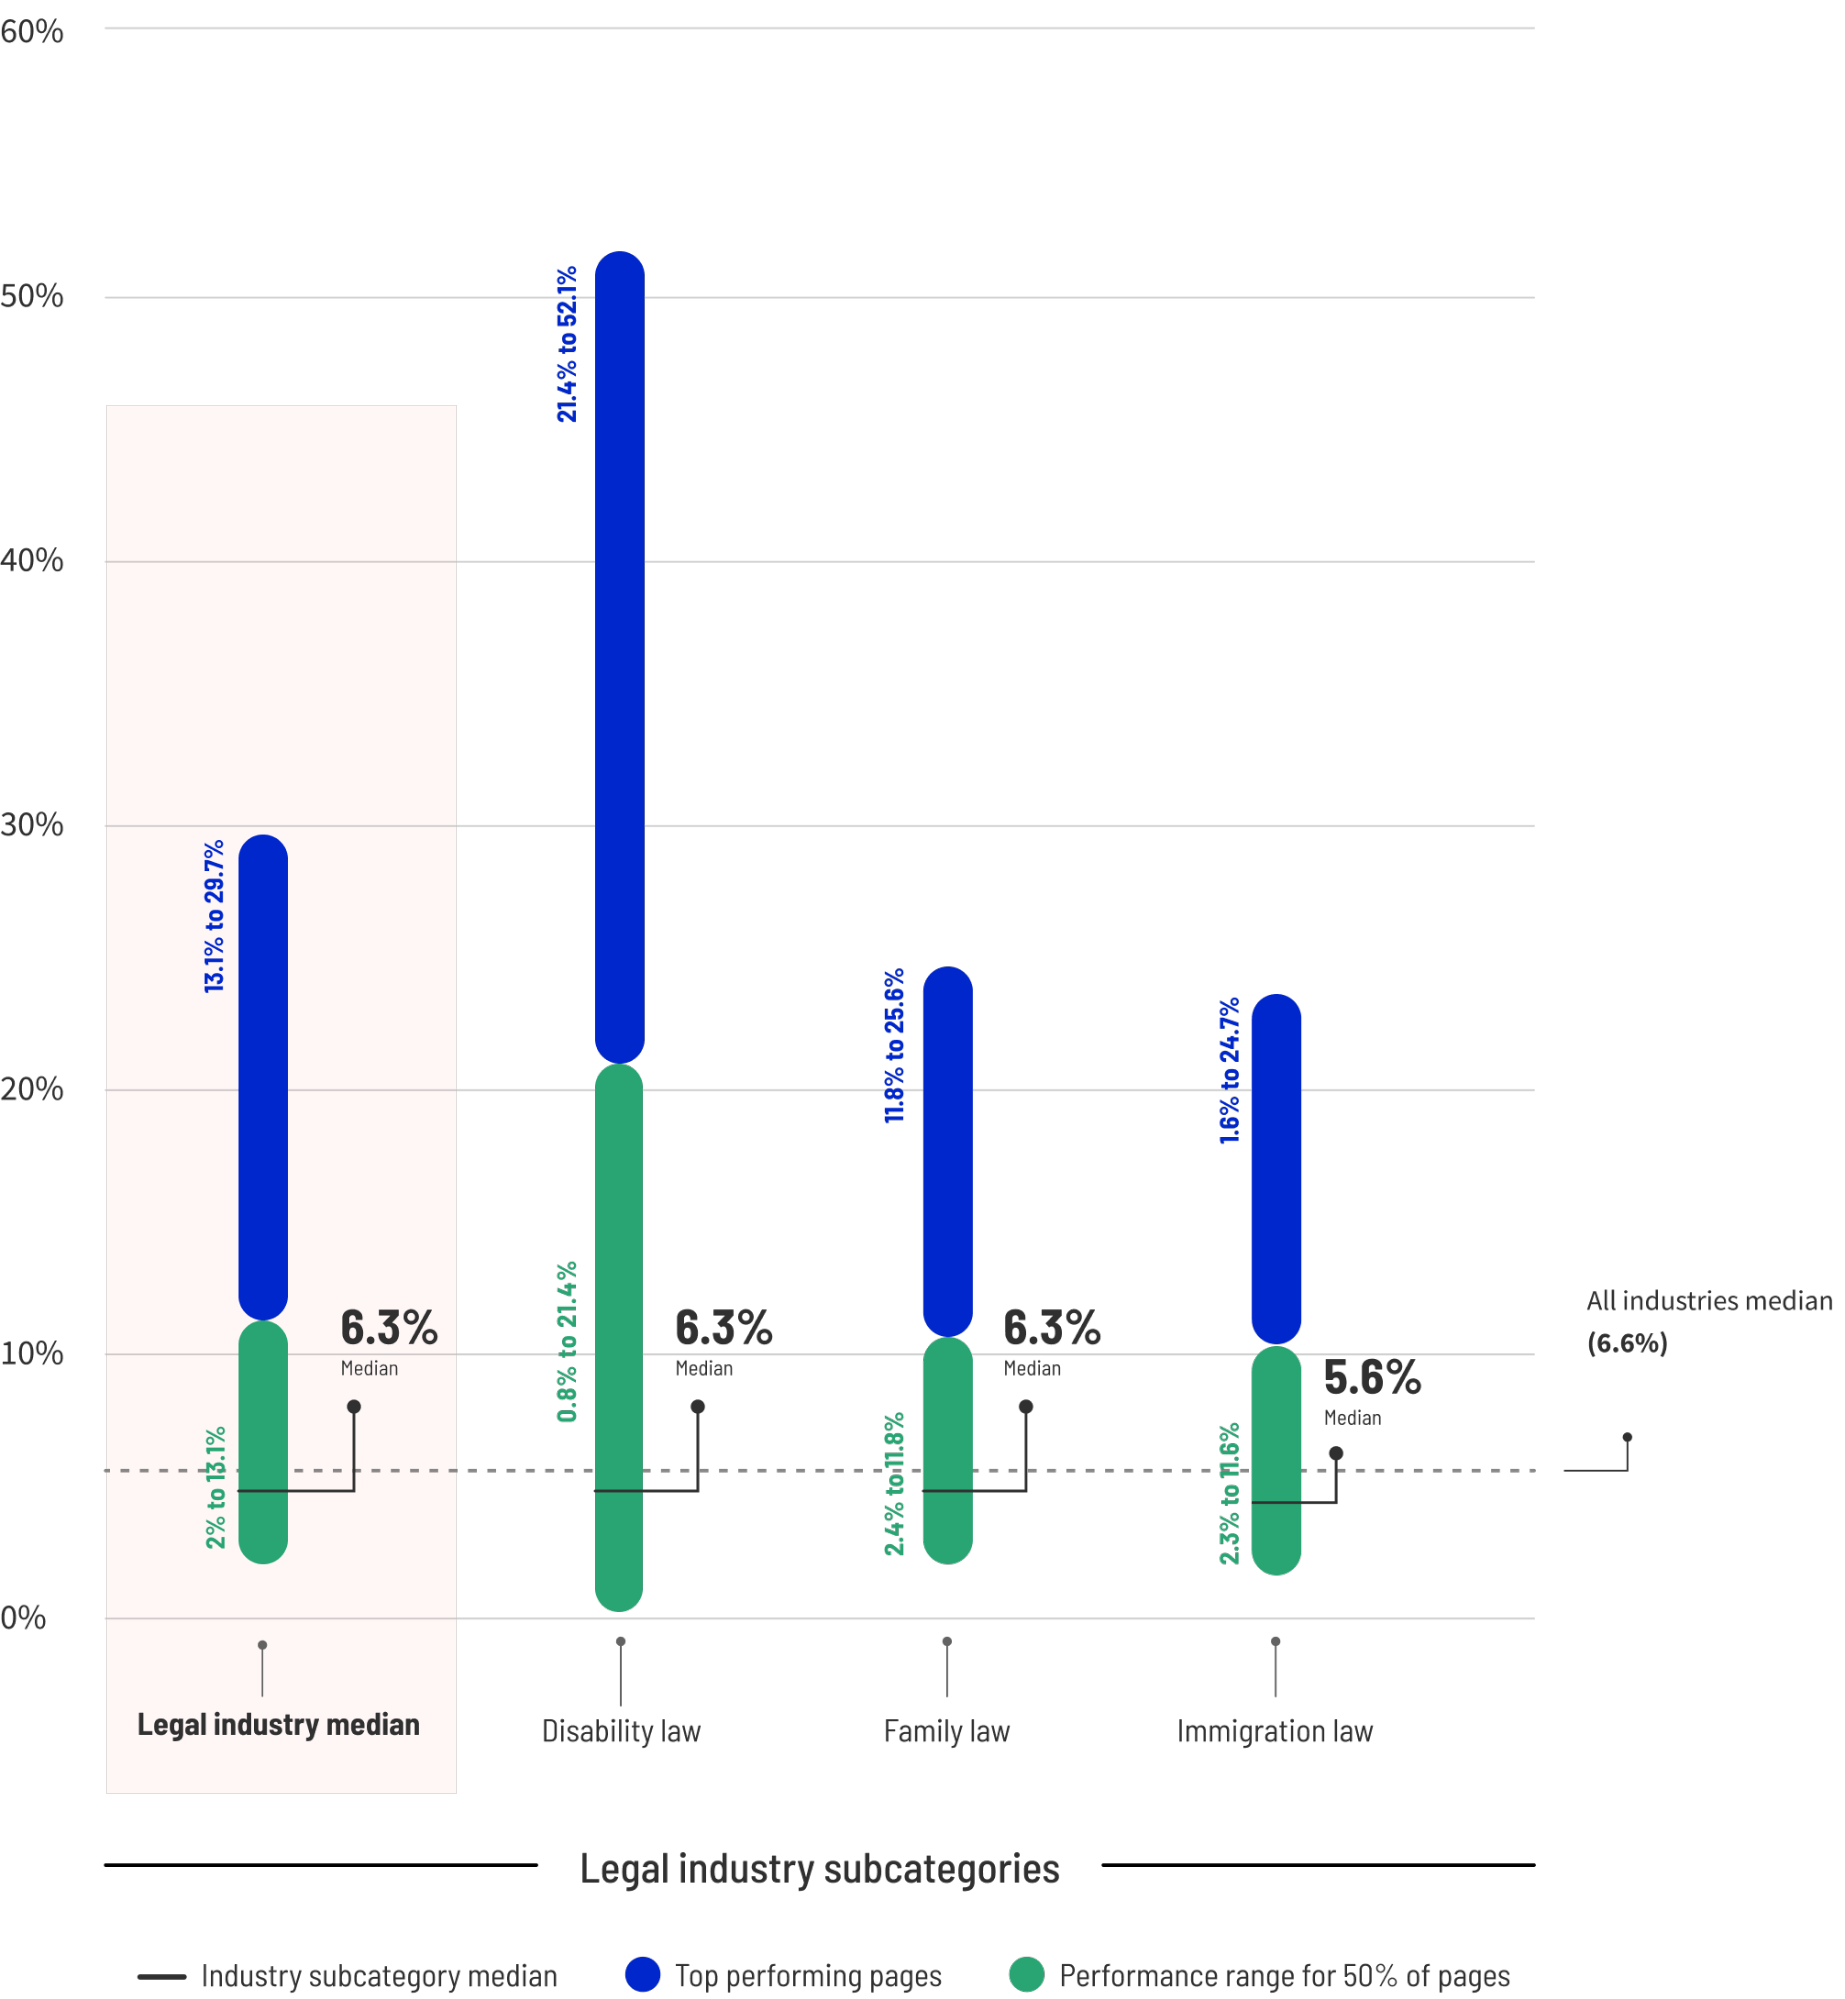
As usual, breaking it down by practice area gets interesting. Disability law and family law both hit that same 6.3% median, while immigration law pages convert slightly lower at 5.6%. At the same time, the upper band for disability law landing pages is far greater than the other subcategories.
Legal landing pages convert better on mobile than desktop. In fact, they convert at 21% on mobile versus 15.9% on desktop. This bucks the trend we see in most other industries, and it makes perfect sense when you think about it. Most people don’t plan to need a lawyer. They may be searching frantically on their phone after an accident, a ticket, or receiving legal papers.
High urgency, immediate need.
To paint the picture even more clearly, paid search traffic converts nearly 2x better than any other traffic source in this industry. Again, a clear indicator that lots of landing page visitors are likely Googling “[practice area] lawyer near me” in a rush and clicking on the first link they see.
What’s a good legal conversion rate?
Top-performing legal landing pages convert at 13.1% or better.
The path from the 6.3% median to 13% or greater isn’t about flashier design or clever copy tricks. It’s about understanding what someone frantically searching for legal help actually needs in that moment. As such, the highest-converting legal pages likely nail three things:
- They establish immediate trust (credentials, case results)
- They speak to the specific legal problem (not general practice areas)
- They make taking the next step absurdly simple (prominent click-to-call buttons)
Average education conversion rate
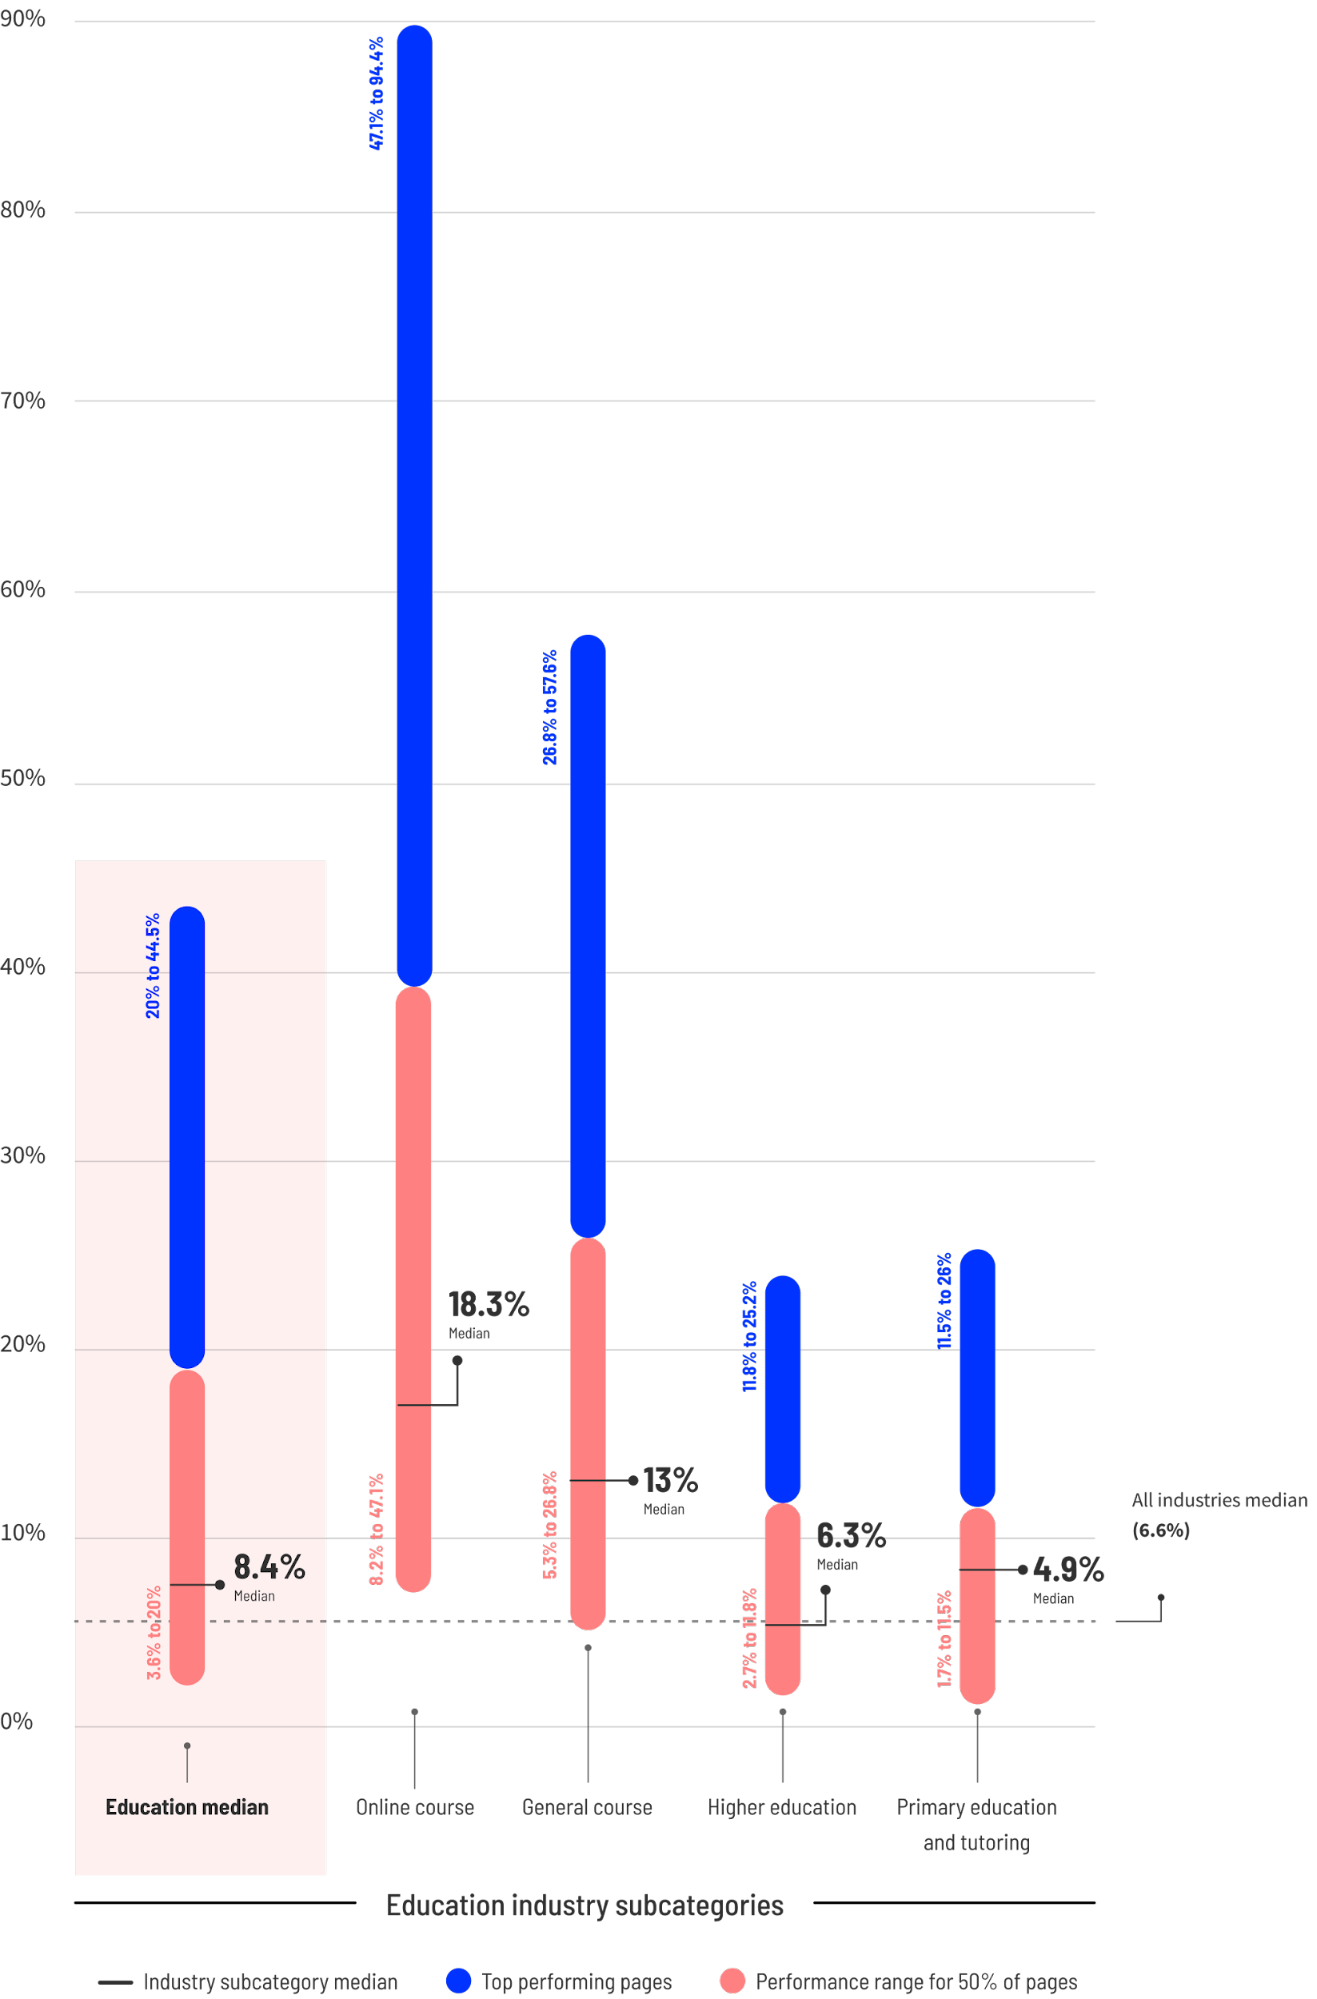
The median conversion rate for Education industry landing pages is 8.4%. That’s about 27% higher than the all-industry median.
Clearly education marketers are doing something right (shoutout to you all!)
When we break it down by education type, online courses are absolutely crushing it with an 18.3% median conversion rate. General course pages follow at 13%, higher education sits at 6.3%, and primary education/tutoring trails at 4.9%.
Our hypothesis here? Online courses solve immediate problems. “Learn Python in 30 days” has a clearer value proposition than “Explore our undergraduate program options.” As such, the highest performing pages likely understand their audience’s urgent needs. They’re not selling education—they’re selling transformation, career advancement, or solutions to specific problems.
PS: Looking to launch your own online course or improve your landing pages? Check out our collection of online course landing page examples for some inspo.
What’s a good education conversion rate?
To break into the top quartile of education pages, you’ll need a conversion rate of 20% or higher.
Traffic source in particular matters here too. Email traffic leads all channels with a 14.1% conversion rate, nearly double that of paid search at 7.3%. If you want to convert more visitors, your best bet long-term may be to build up your email list before going into hard-sell mode with a massive ad budget.
Average entertainment conversion rate
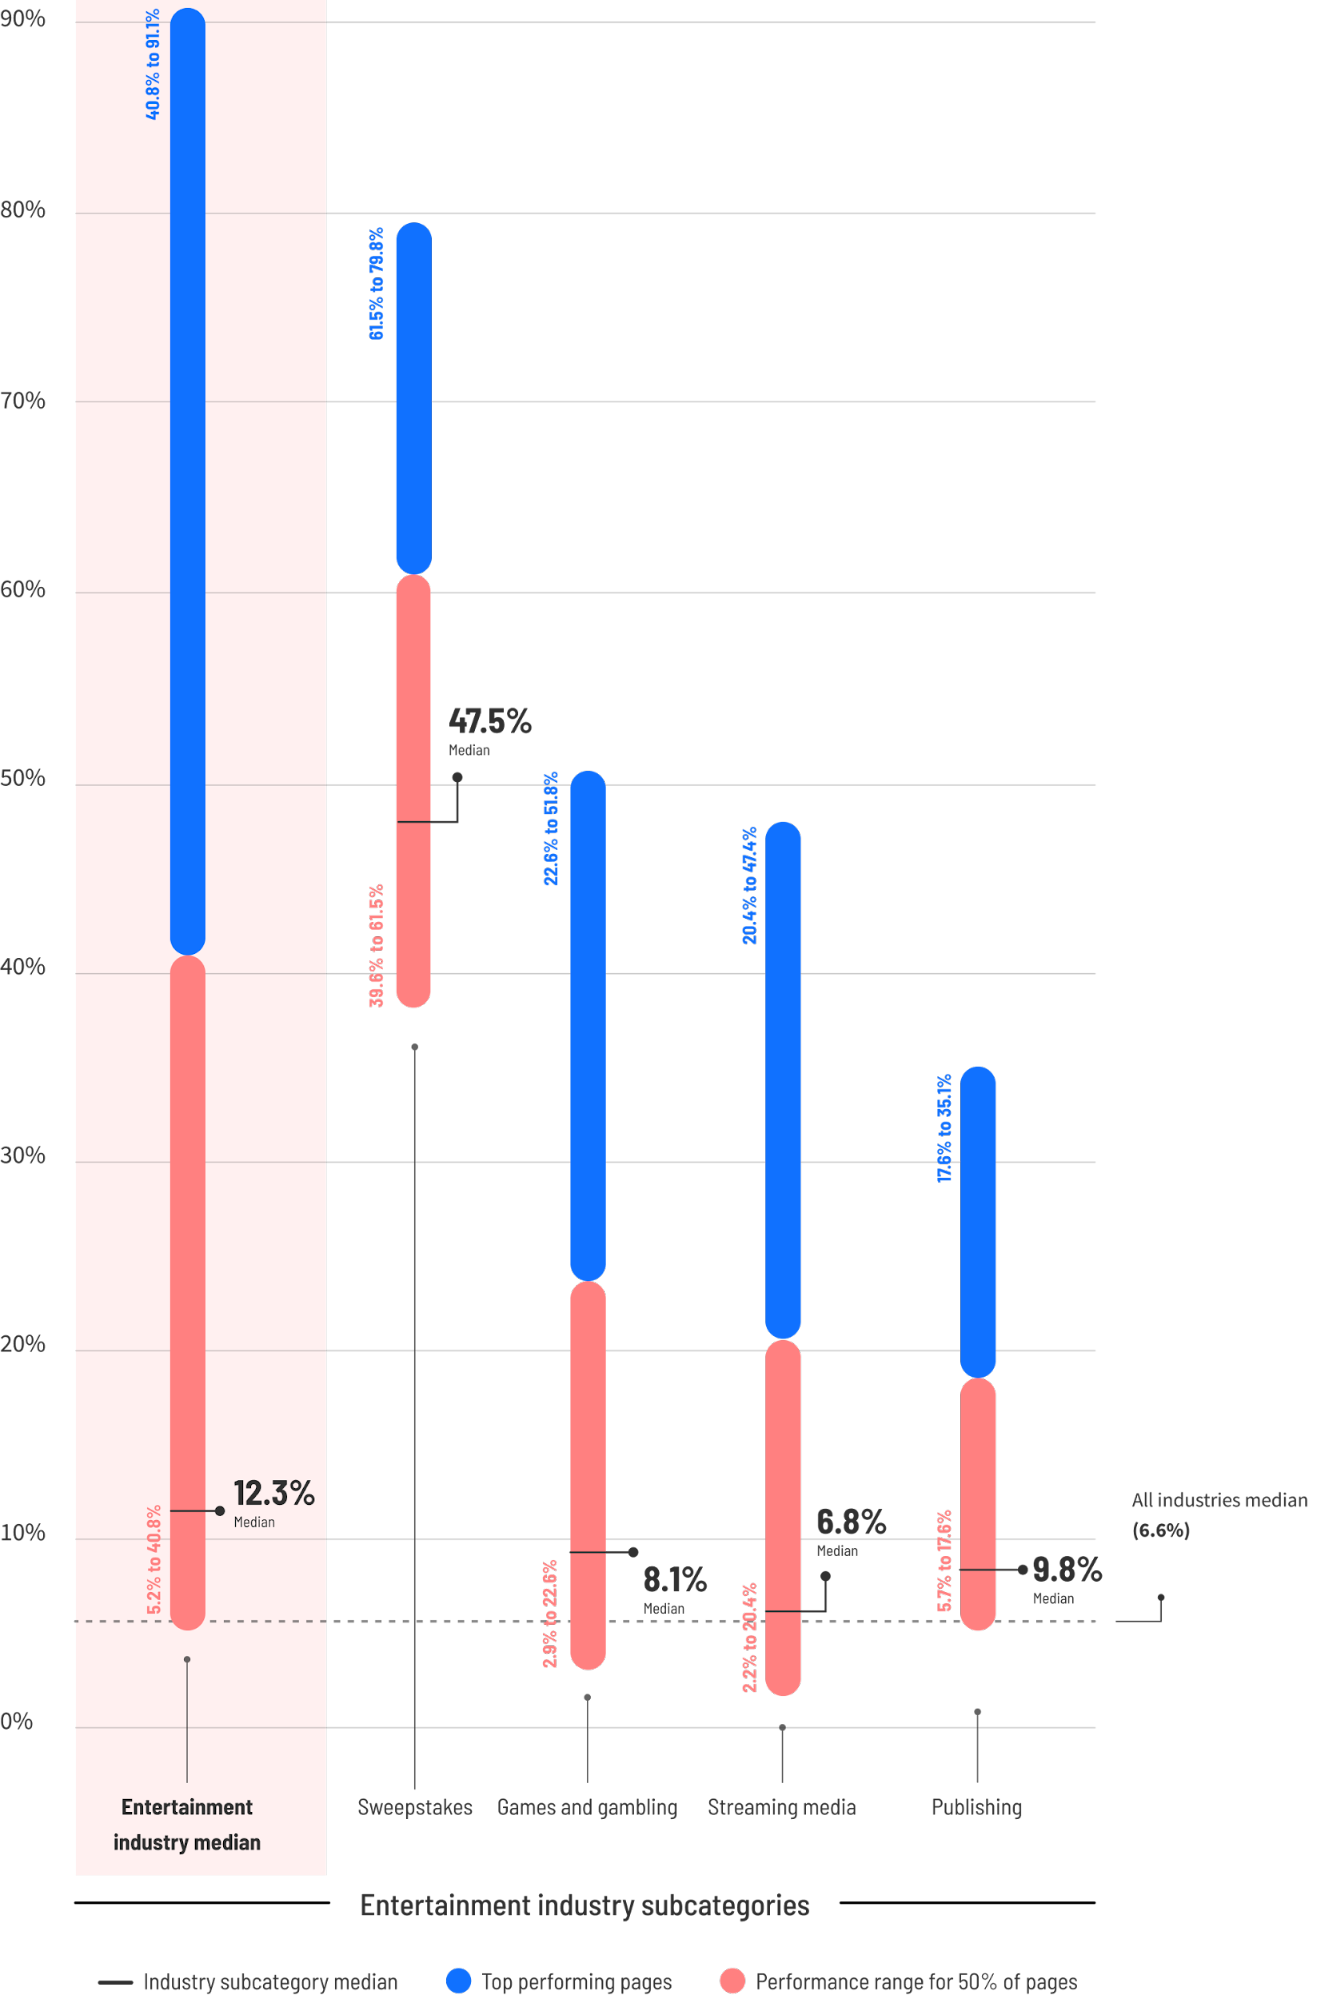
Entertainment landing pages see a median conversion rate of 12.3%—nearly double the all-industry median.
Entertainment marketers are also crushing it compared to most other industries.
And when we drill down, the numbers get even more interesting. Take sweepstakes landing pages. They’re converting at a median of 47.5%. Yes, you read that right. Nearly half of visitors are converting. The top performers reach as high as 79.8%.
But context matters here. The conversion action on sweepstakes pages might be as simple as submitting an email address or clicking a “Enter Now” button—much easier than completing a purchase or a multi-field form.
Other subcategories show different patterns:
- Publishing pages: 9.8% median rate
- Games and gambling: 8.1% median rate
- Streaming media: 6.8% median rate
These differences likely reflect varying conversion goals. A streaming service might be asking for credit card info and a commitment, while a publisher might just want an email signup.
What’s a good entertainment conversion rate?
To rank among the entertainment elite, your pages should convert at 40.8% or higher.
Keep in mind this threshold is likely heavily influenced by those high-performing sweepstakes pages we mentioned. Your specific conversion goal makes a big difference in what’s realistic to expect.
- A “good” rate for a page asking visitors to enter an email for a chance to win? Maybe 40% or more.
- A “good” rate for a page asking visitors to subscribe to a streaming service with their credit card? Probably much lower.
When benchmarking your own performance, consider the complexity of your conversion action first, then look at industry numbers second.
5 conversion rate optimization ideas to help you get more conversions today
Benchmarks tell you where you stand—but how do you actually move the needle?
Here are 5 tactics worth testing on your pages. None guarantee overnight success, but they’re all backed by data from top-performing pages:
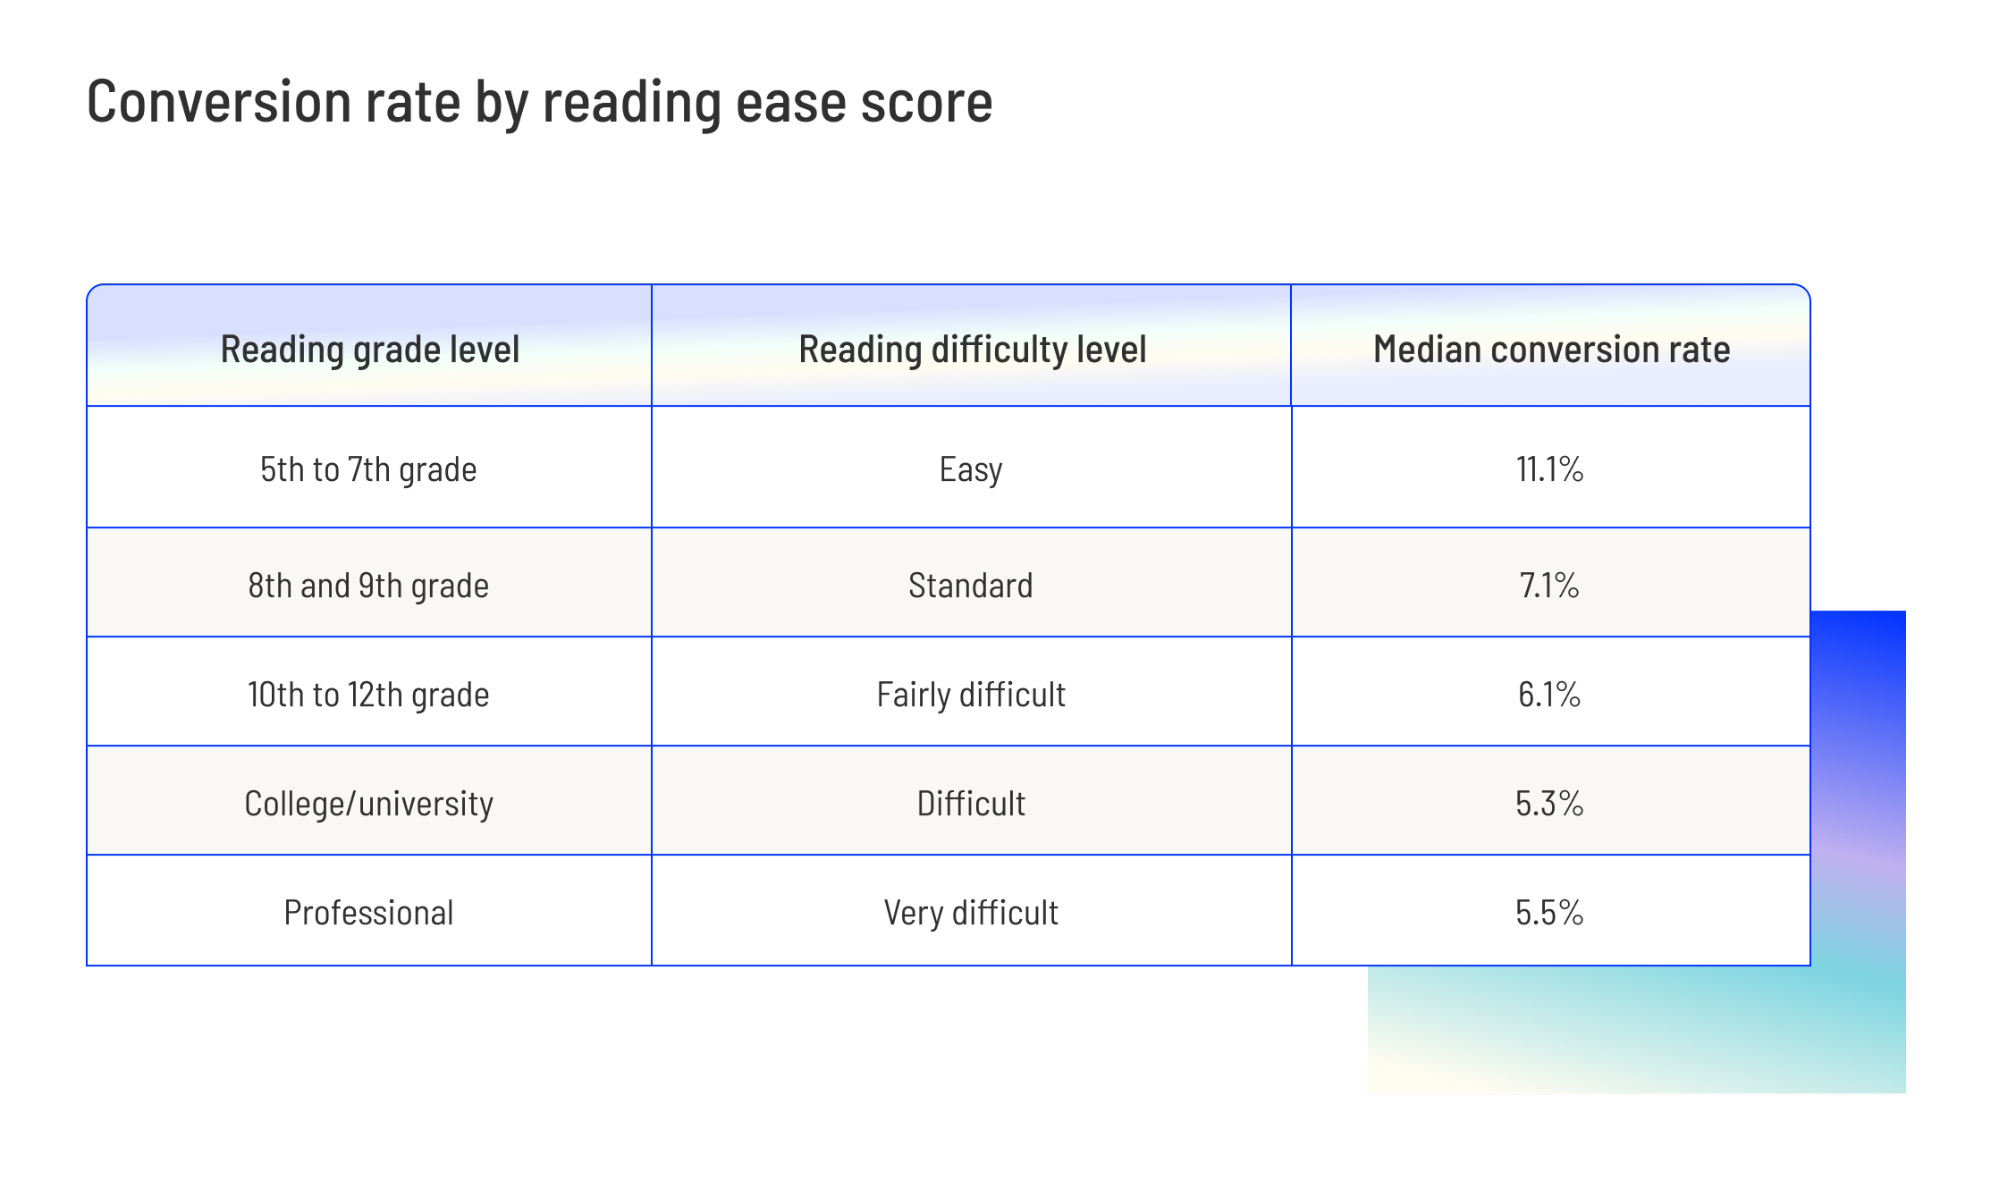
1. Simplify your copy to a 5th-7th grade reading level
Pages with simpler language convert dramatically better. Drop the jargon, shorten your sentences, and talk like a real person.
Our research shows pages written at a 5th-7th grade level convert at 11.1%—that’s 56% better than 8th-9th grade content and more than double what you’d get with “professional” language.
2. A/B test different CTAs and form lengths
Small tweaks can drive big wins. Try different button colors, CTA wording, or form field arrangements. Test one element at a time so you know exactly what moved the needle.
3. Add strategic social proof
Chances are, people trust other people more than they trust your marketing. Try placing testimonials, review counts, or client logos near your conversion points—not buried at the bottom of your page where nobody sees them.
4. Fix your mobile experience
Mobile accounts for 83% of landing page visits but often converts worse than desktop. Make sure both experiences are smooth, fast, and frustration-free. Test your page on actual devices, not just in preview mode.
5. Remove distractions
Every link that doesn’t lead to conversion is a potential exit. Strip away navigation menus, social buttons, and anything else that competes with your main CTA.
Conversion optimization isn’t a one-time thing—it’s an ongoing process. To go even deeper, take a peek at our guides on increasing conversion rates and tracking the right metrics.
SUBSCRIBE
Don’t miss out on the latest industry trends, best practices, and insider tips for your marketing campaigns
Start outperforming your benchmarks
Benchmarks tell you where you stand—but the real work is in making improvements.
Whether you’re pushing a 2% conversion rate to 3% or scaling a solid performer even higher, the optimization journey never really ends. The marketers seeing the biggest returns focus on four things: clarity in messaging, speed in page loading, trust through social proof, and matching visitor intent with offer.
Most of all? They test. Constantly.
The gap between average and excellent represents a massive opportunity in every industry. The companies capturing that opportunity aren’t magically better—they’re just more systematic about how they approach conversion.
Want to join them?
Give Unbounce a spin (with a 14 day free trial).
The Unbounce landing page builder lets you build high-converting pages (without coding or design skills). From there, you can run an unlimited amount of A/B tests on each page—all while Smart Traffic automatically routes visitors to their best-fit page variant.
It’s like having a conversion optimization team working 24/7—but without the enterprise price tag. Get started today.

Related articles